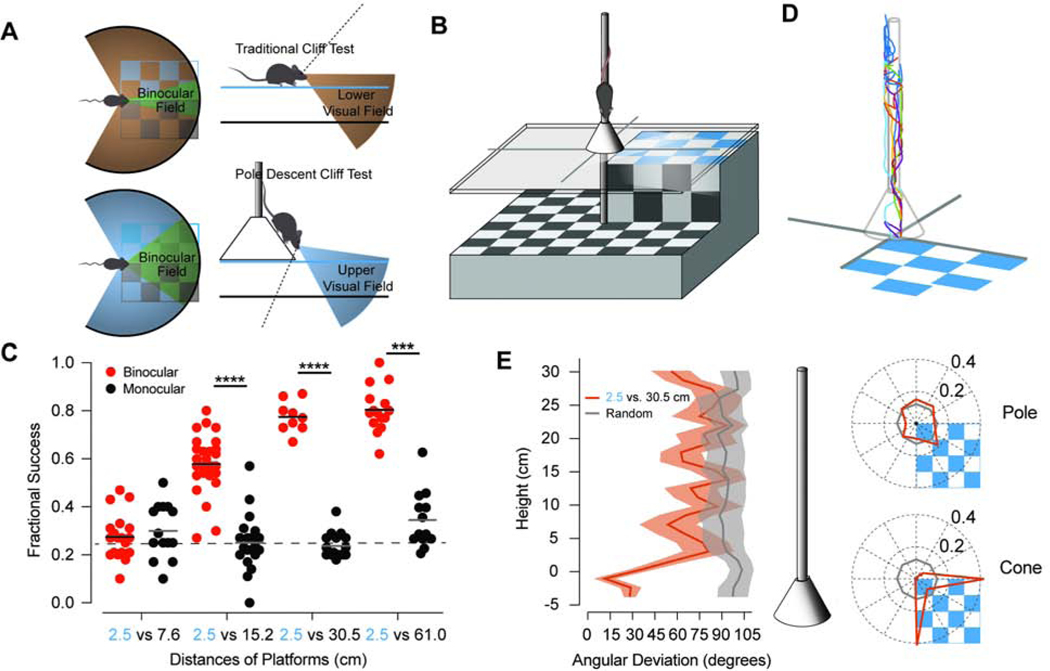
Figure 1. The Pole Descent Cliff Task Reveals the Binocular Component of Depth Perception.
(A) The orientation of mouse eyes results in greater binocular overlap (green) in the upper (blue) versus the lower (brown) visual field. Traditional cliff tests orient the mouse parallel to the discriminated surfaces, which will be mostly represented in the lower visual field. The pole descent reorients the mouse downward so that the discriminated surfaces are mostly in the upper visual field. (B) A schematic of the pole descent cliff task. Mice descend a pole 1 cm in diameter to cone positioned above a plate of glass. Small aluminum rails obscure the edges beneath separating the quadrant with the nearest platform from the three more distant surfaces. The entire interior surface of the box is covered in a black and white checkerboard pattern, including the walls (not shown). (C) Fractional success of mice under either binocular (red) or monocular viewing conditions (black) descending to the nearest platform fixed at 2.5 cm relative to the distance of the remaining platforms at 7.6 cm (n=19 binocular, 14 monocular), 15.2 cm (n=28,20), 30.5 cm, =(n=9,17) and 61.0 cm (n= 15,13) Each mouse (circle) was tested 10–15 times at only one pair of depths and either binocular or monocular vision. Dashed line is a chance fraction of 0.25. (***, p =.0002; **** p < .0001, Kruskal Wallis test) (D) A sample of three-dimensional traces of the position of the mouse descending the pole over time when exiting to the 2.5 versus the 30.5 cm surface. Each color is a different trial. (E) (left) Angular position around the pole with respect to the near surface varies substantially until the mice reach the cone after descending the pole. (middle) Shaded regions are standard error. (right) The angular position is similar to a random distribution on the pole (upper) and is biased towards the edges within the quadrant of the near surface when the mice reach the cone (lower). See also Figures S1, S2, and Videos S1 and S2.

