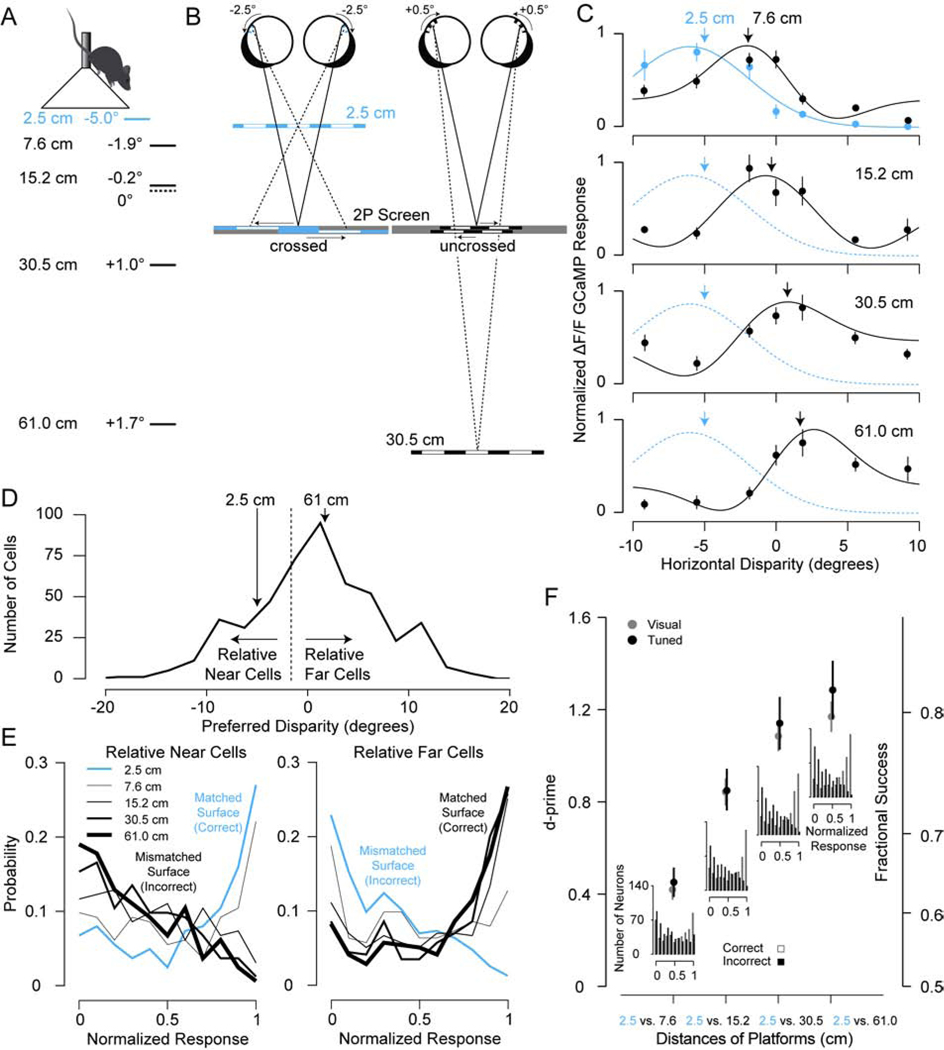
Figure 2. Neuronal Discrimination of PDCT Depths with Disparity Tuned Neurons in the Mouse Visual Cortex.
(A) Binocular disparity for the mouse was computed for each surface depth used in the pole descent cliff task (PDCT). The dashed line corresponds to zero disparity for the viewing distance. (B) An example of retinal projections for 2.5 and 30.5 cm surfaces is shown to the right. The gray screen shows the horizontal shift for the left (upper) and right (lower) eye images necessary to produce stereoscopic surfaces that correspond to the depths of these PDCT surfaces. The projections are not drawn to scale for clarity. (C) Example disparity tuning curves measured with two-photon microscopy with preferred disparities matching the PDCT surfaces. Error bars are standard error (n = 10 repeats). (D) Distribution of disparity tuning preferences for neurons in the visual cortex. The unimodal distribution was divided (dashed line) into relative near and far tuned based on the PDCT disparities2,4. (E) Distribution of normalized responses for relative near and far tuned neurons for each surface. (F) Neuronal discrimination measured with d’ between normalized responses to the two compared surfaces for significant disparity-tuned neurons (Tuned, N = 172) and significant visually-responsive neurons (Visual, N = 477). Fractional success was estimated from d’. Insets are combined distributions of correct and incorrect responses for relative near and far tuned cells. Error bars are standard error and all data points are statistically significantly greater than zero (bootstrapped, P<0.001).

