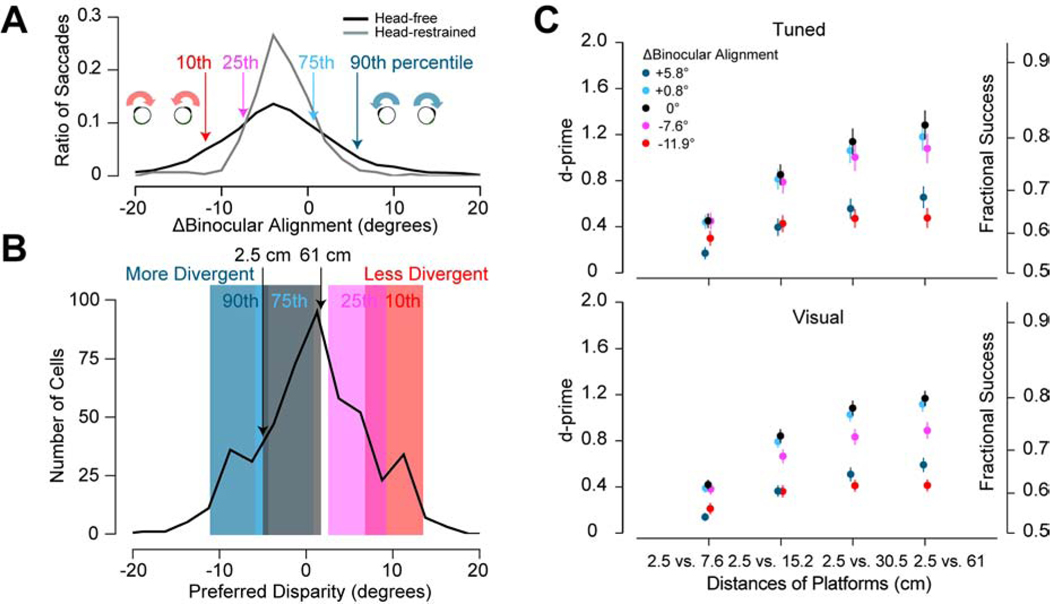
Figure 4. Robustness of Neuronal Discrimination with Changes in Binocular Alignment.
(A) Distribution of saccade size differences for head-fixed and head-free freely moving mice16. A negative difference corresponds to the eyes rotating inward (left, red) and a positive difference corresponds to the eyes rotating outward (right, blue). Arrows highlight percentiles of the data that were used to test performance for changes in binocular alignment. (B) Distribution of preferred disparities for all significant visually response neurons2. Highlighted regions correspond to the disparity range represented by the surfaces used in the task for the average binocular alignment (gray) and corresponding changes in alignment noted in (C). (C) Neuronal discrimination performance for different binocular alignments for significant disparity tuned (top) and visually responsive (bottom) neurons. Error bars are standard error. See also Figure S4.

