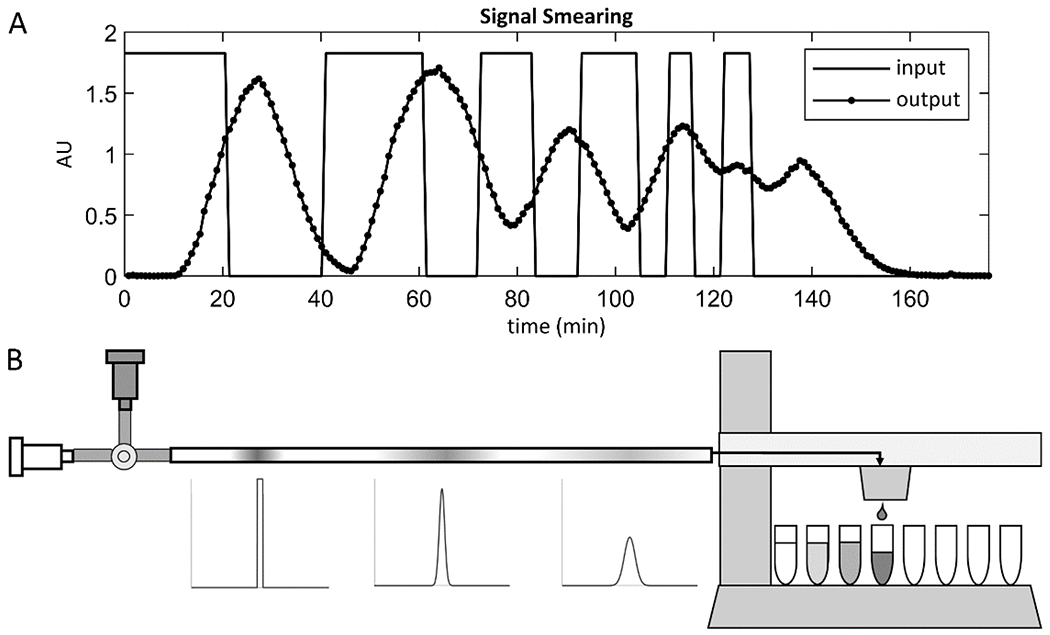
Figure 3. Signals passing through a flow system are smeared by dispersion according to the residence time distribution of the system.

A concentration vs. time signal at the inlet of a flow system, such as a signal generated by dynamic cell secretion or manual input of solute pulses, becomes “smeared” due to dispersion as it passes through the flow system. This is demonstrated in the graph (A), where the rectangular concentration vs. time signal generated at the inlet of a 1 m length of tubing by switching the flow source between pure water and tracer is smeared by the time it is measured at the outlet. The shape and extent of smearing are determined by the residence time distribution (RTD) of the flow system, which can be measured using the method shown in the schematic (B). A valve at the system inlet is switched to allow a brief pulse of tracer solution to flow into the system, approximating an infinitesimal impulse. The valve is then switched back to pure water, and as the tracer pulse flows through the system, it spreads and takes the shape of the RTD of the system. Fractions are collected until all the tracer has exited the system, and the concentration vs. time signal is measured to reveal the RTD.
