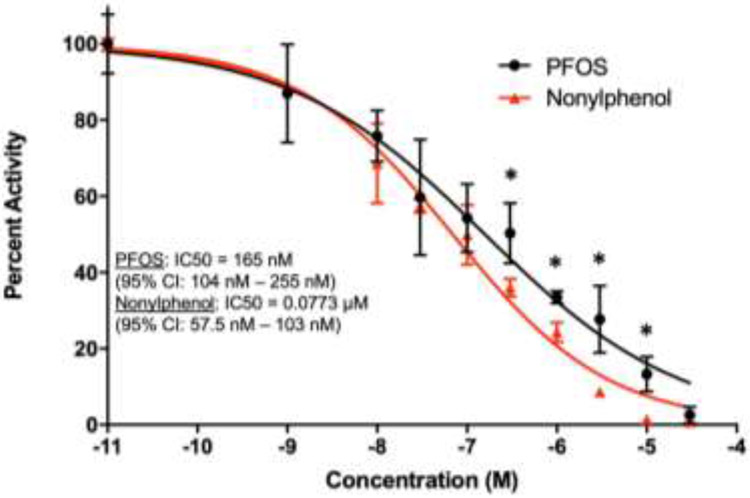
Fig. 2: Concentration-response curve for the inhibition of CYP2B6 by PFOS in comparison to the positive control, nonylphenol.

IC50 and 95% CI values were determined using a sigmoidal dose response least squares fit test performed on GraphPad Prism 7 (n = 3). Multiple Student t-test’s were performed to determine significance between PFOS and Nonylphenol. * indicates a significant difference of p < 0.05.
