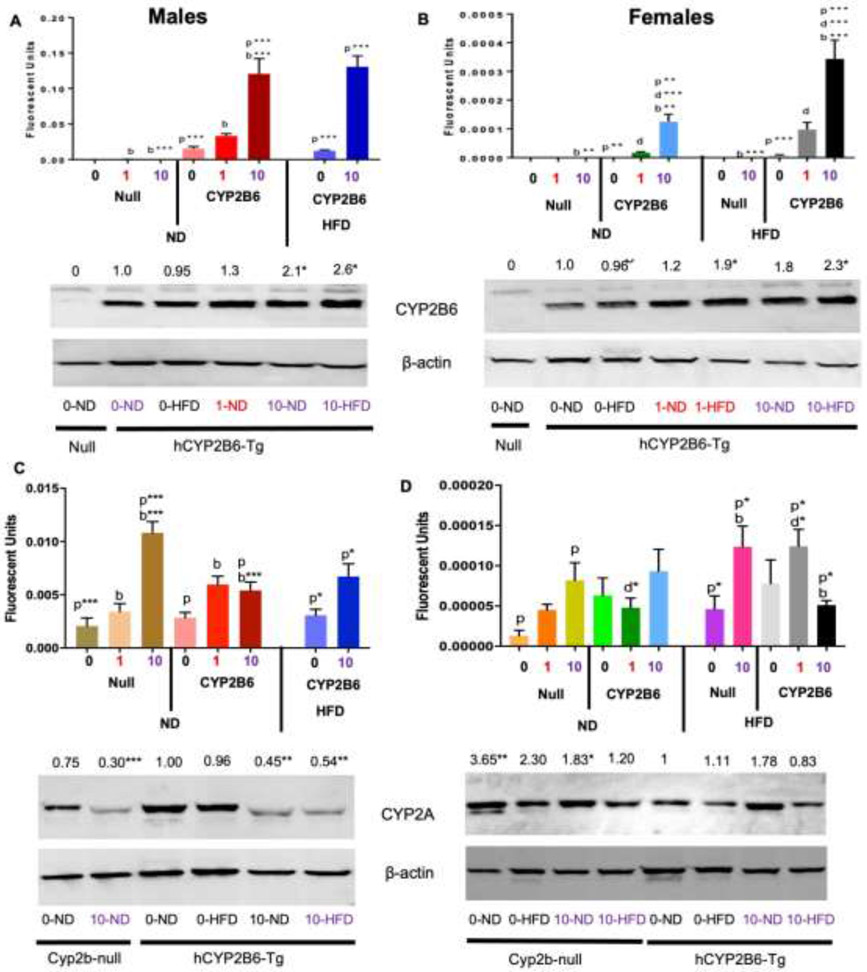
Fig. 3: CYP2B6 (A & B) and Cyp2a5 (C & D) hepatic gene and protein expression in male and female mice.
Mice were treated as described in the Materials and Methods and CYP2B6 and Cyp2a5 expression measured by qPCR (n = 4-5) and Western blotting (n = 2-3). ). The values above the Western blots reflect relative change in protein expression compared to 0-PFOS ND. Statistical significance was determined by one-way ANOVA followed by Fisher’s LSD when comparing 3 or more groups (qPCR) and Student’s t-test when comparing two groups (Western blots). For qPCR, ‘p’ indicates difference between PFOS concentrations, ‘g’ indicates difference between gender, ‘d’ indicates difference between diets, ‘b’ indicated difference between genotypes. A letter indicates a p < 0.05, letter w/ * indicates p < 0.01, letter w/ ** indicates p < 0.001 and a letter w/ *** indicates p < 0.0001. * indicates a significant difference of p < 0.05 in Western blots.

