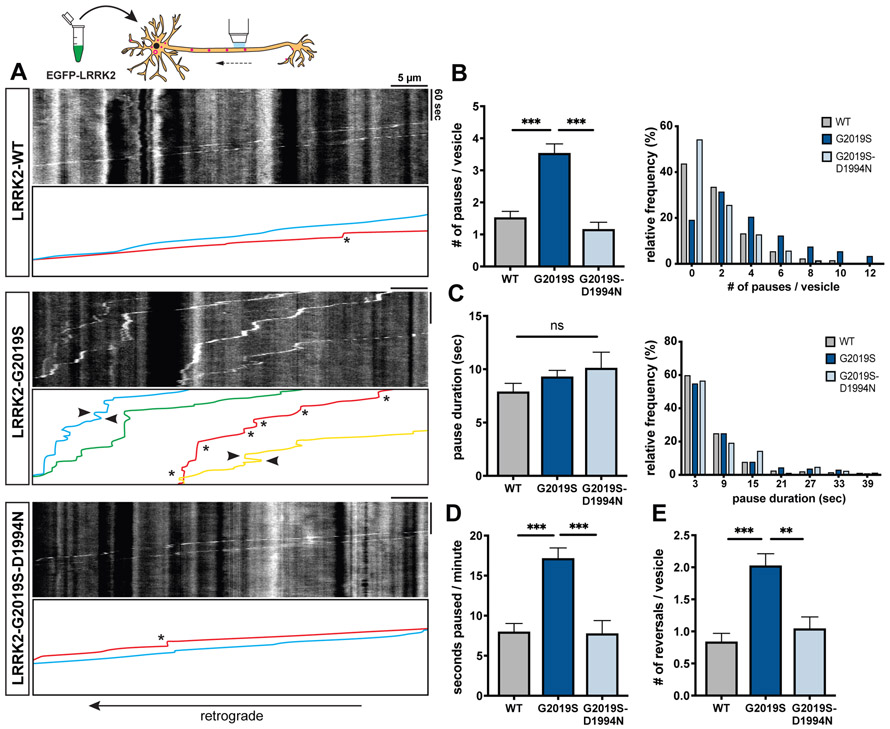
Figure 1. Overexpression of LRRK2-G2019S disrupts processivity of axonal AV transport.
(A) Kymographs of mCherry-LC3 vesicles in EGFP-LRRK2-WT, −G2019S, and −G2019S-D1994N expressing axons. Asterisks indicate pauses. Arrowheads point to reversals. See also Video S1. (B-C) Bar graph and frequency distribution of (B) pause number per vesicle and (C) pause duration during AV transport in WT, G2019S, and G2019S-D1994N expressing neurons. Frequency distribution does not show pauses > 42 sec (WT: 2.54%, G2019S: 2.87%, G2019S-D1994N: 3.49%). (D) Fraction of time paused (as measured by seconds paused per minute), (E) Number of reversals per AV in WT, G2019S, and G2019S-D1994N expressing axons (mean ± SEM; n = 87-139 AVs from 17-20 neurons from 3 independent cultures; ns, not significant, p=0.44; **p=0.0008; ***p<0.0001; Kruskal-Wallis with Dunn’s multiple comparisons test). See also Figures S1A-C for quantification of AV directionality and density. Figure S3 and Figure S4 show the effect of LRRK2-G2019S overexpression on microtubule and LAMP1-vesicle dynamics, respectively.

