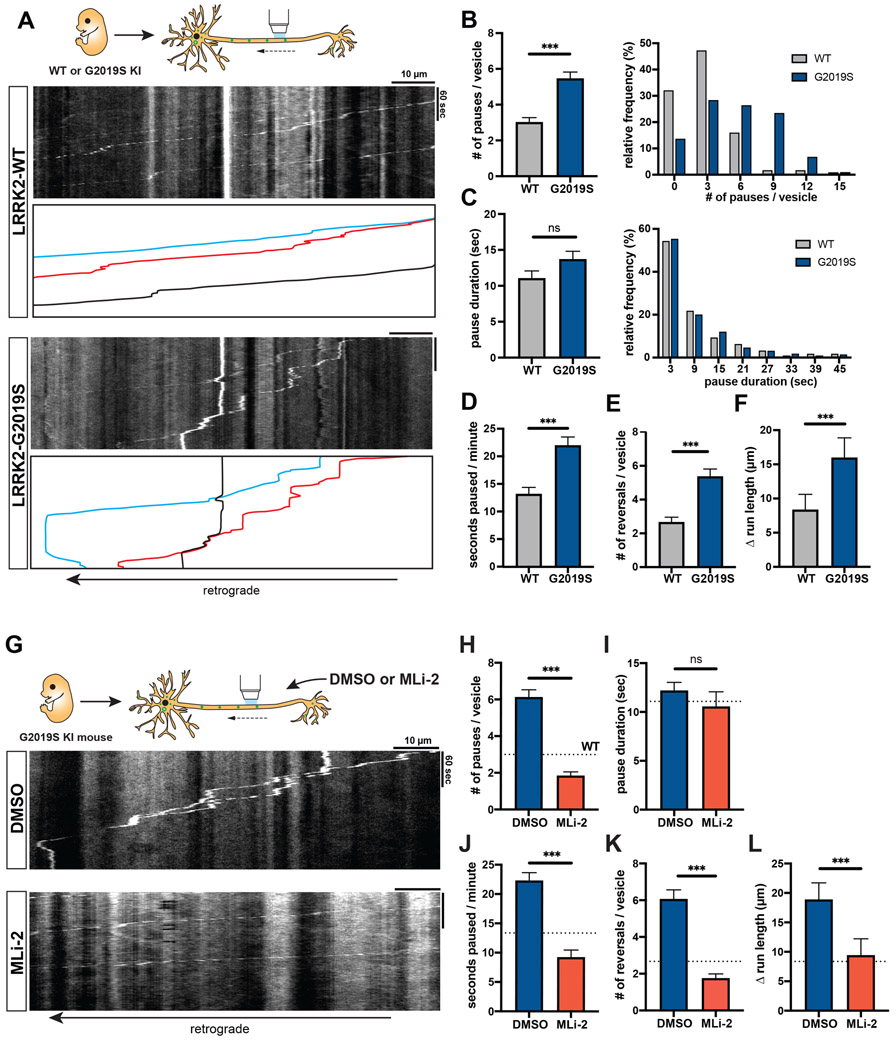
Figure 2. AV transport is disrupted in mouse LRRK2-G2019S knock-in neurons and rescued by LRRK2 kinase inhibition.
(A) Kymographs of axonal EGFP-LC3 vesicles in WT and G2019S KI mouse cortical neurons. See also Video S2. (B-C) Bar graph and frequency distribution of (B) pause number per vesicle and (C) pause duration during AV transport in WT and G2019S KI neurons. Frequency distribution does not show pauses > 48 sec (WT: 2.95%, G2019S: 6.89%). (D) Fraction of time paused, (E) Number of reversals, (F) Δ run length (difference between total run length and net run length) of AVs in WT and G2019S KI neurons (mean ± SEM; n = 112-126 AVs from 26 neurons from 3 independent cultures; ns = not significant, p=0.78; ***p<0.0001; Mann-Whitney test). Figures S1D-G show LRRK2 expression and AV directionality in WT and G2019S KI neurons. (G) Kymographs of axonal EGFP-LC3 vesicles in mouse G2019S KI neurons treated overnight with DMSO or 100 nM MLi-2. See also Video S3. (H) Pause number, (I) Pause duration, (J) Fraction of time paused, (K) Number of reversals, (L) Δ run length of AVs in G2019S KI neurons treated with DMSO or MLi-2 (mean ± SEM; n = 106-116 AVs from 24-28 neurons from 3 independent cultures; ns = not significant, p=0.02; ***p<0.0001; Mann-Whitney test with Bonferroni correction for multiple testing: p<0.0125 was considered statistically significant). Dotted lines indicate the respective average observed in untreated WT neurons. See also Figures S2A-B for phospho-Rab Western blots of WT or G2019S KI neurons +/− MLi-2.
Microtubule dynamics in G2019S KI neurons and the effect of MLi-2 on microtubule dynamics are shown in Figures S2 and S3. Figure S4 shows LAMP1-vesicle dynamics in G2019S KI neurons.

