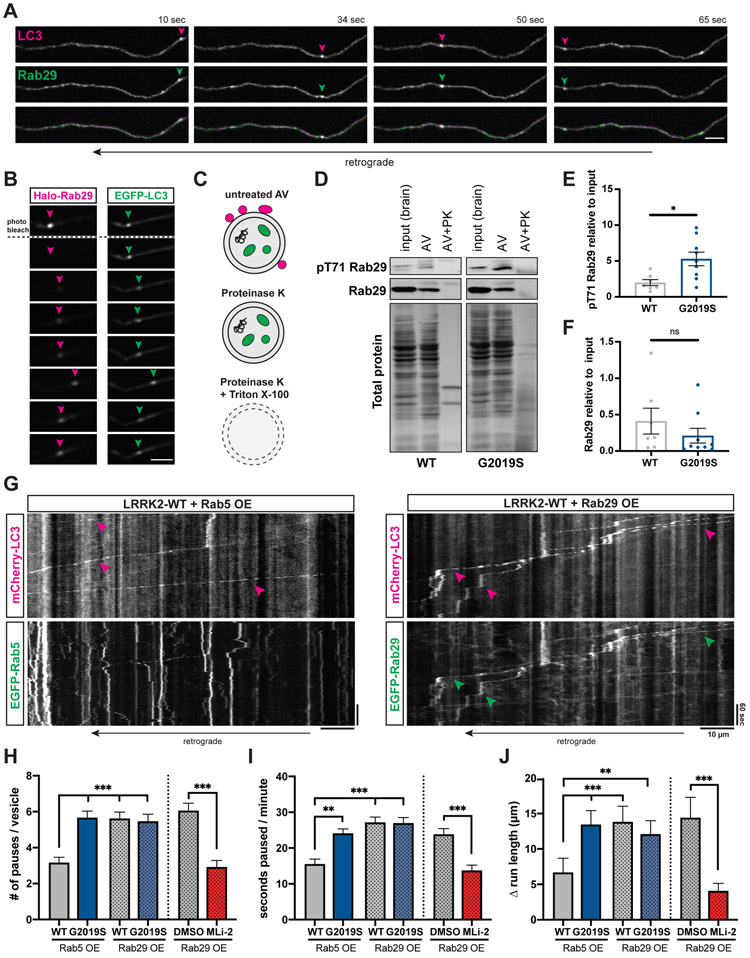
Figure 5. Overexpression of Rab29 disrupts AV transport.
(A) Time lapse images of axonal mCherry-LC3 and EGFP-Rab29 vesicles in a WT mouse cortical neuron. Scale bar, 5 μm. See also Video S5. (B) Fluorescence recovery after photobleaching Halo-Rab29 signal of an EGFP-LC3 labeled AV. Arrowheads point to the position of the AV. Scale bar, 5 μm. See also Figures S6A-C and Video S6. (C) Proteins associated with the outer membrane of isolated AVs are degraded after treatment with Proteinase K. AV cargo is only degraded by Proteinase K after membrane permeabilization. (D) Western Blot of pT71 Rab29 and total Rab29 from brain lysate, autophagosome fraction, and autophagosome fraction after treatment with Proteinase K. PK, Proteinase K. (E-F) Western Blot quantification of (E) pT71 Rab29 levels (mean ± SEM; n = 8-9 biological replicates; *p=0.022; Mann-Whitney test) and (F) total Rab29 levels (mean ± SEM; n = 7-9 biological replicates; ns, not significant, p=0.25; Mann-Whitney test) in autophagosome fraction of WT and G2019S KI mice. Data shown are normalized to total protein and relative to whole brain lysate. Western Blots of LRRK2, GM130, and LC3 are shown in Figures S6D-F. (G) Kymographs of axonal EGFP-Rab5 or EGFP-Rab29 vesicles, and mCherry-LC3 vesicles in mouse WT cortical neurons. Magenta arrowheads point to tracks of mCherry-LC3 vesicles; green arrowheads highlight EGFP-Rab29 tracks that colocalize with mCherry-LC3 tracks. (H) Pause number, (I) Fraction of time paused, (J) Δ run length of AVs in WT and G2019S KI neurons overexpressing Rab5 or Rab29, and in Rab29 overexpressing WT neurons treated with DMSO or MLi-2 (Overexpression of Rab5 or Rab29: mean ± SEM; n = 107-149 AVs from 27-38 neurons from 3-4 independent cultures; ns, not significant, p>0.06; **p<0.001; ***p<0.0001; Kruskal-Wallis with Dunn’s multiple comparisons test. Treatment of Rab29 overexpressing neurons with DMSO or MLi-2: mean ± SEM; n = 78-109 AVs from 26-27 neurons from 3 independent cultures; ns, not significant, p=0.19; ***p<0.0001; Mann-Whitney test). See also Figures S6G-H.

