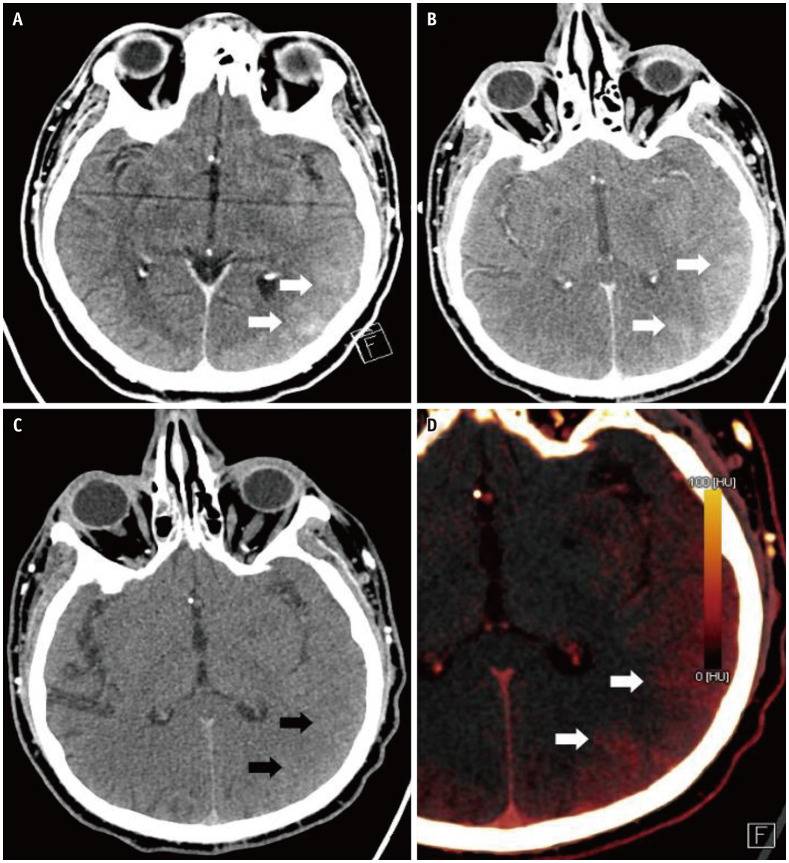
Fig. 1. A 48-year-old male with post-tissue plasminogen activator after left middle cerebral artery infarct.
A. Axial CT head image shows evolving left MCA infarction displaying local mass effect with sulcal effacement in the left temporal and parieto-occipital lobes. High attenuation gyri (arrows) in this region can either be due to petechial hemorrhage or contrast staining. Dual-energy CT head. B. Post-contrast image demonstrates contrast staining in the region of infarction seen as hyperattenuating gyri (arrows). C. Virtual non-contrast image corresponding to normal gyri appearance (arrows) and no corresponding high-density areas, confirming contrast staining rather than hemorrhage. D. Color coded iodine map shows the distribution of iodine in the regions of contrast staining (arrows).

