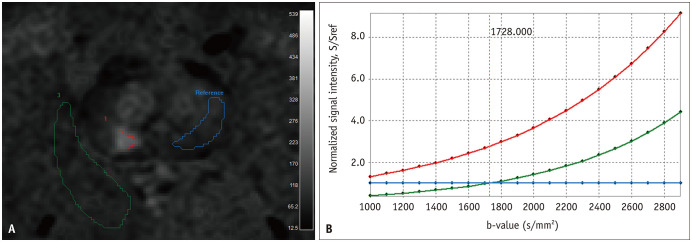
Fig. 2. An example showing quantitative analysis in a 73-year-old man with International Society of Urological Pathology grade 3 prostate cancer of right PZ as confirmed by targeted biopsy.
A. Three ROIs were manually drawn: focal cancerous area of diffusion restriction (red ROI), contralateral PZ (blue ROI), and ipsilateral pP region (green ROI). B. From the three ROIs, three types of signal intensity ratio curves were generated with signal intensity of contralateral PZ as the reference (red = cancer/contralateral PZ; green = ipsilateral pP region/contralateral PZ; and blue = contralateral PZ/contralateral PZ). The green and blue curves crossed at b-value of 1728 s/mm2, which means that signals of contralateral PZ and ipsilateral pP region are similar at this b-value (i.e., homogeneous background signal intensity). This b-value was regarded as the quantitatively analyzed optimal b-value of synthetic diffusion-weighted imaging for evaluating the MRI-suggested prostatic index lesion in this patient. pP = periprostatic, PZ = peripheral zone, ROI = region of interest

