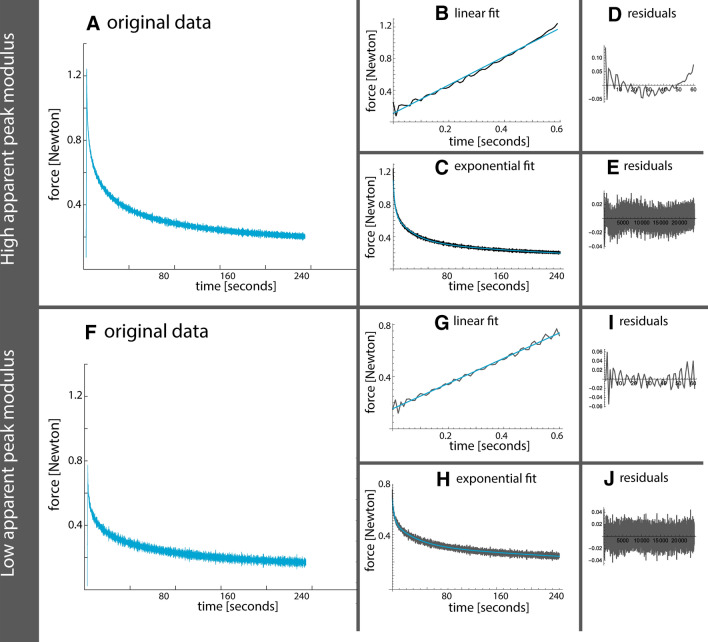
Fig. 1.
Example of data fits (before conversion to apparent modulus) with a higher apparent peak force (upper part) and lower apparent peak force (lower part). a, f The original data in blue. b, g The first linear loading part of the stress–relaxation test with fitted linear regression in blue. Corresponding residuals are shown in d, i. c, h The second part of the stress–relaxation test fitted with a third-order exponential decay in blue. Corresponding residuals are shown in e, j

