Fig. 4.

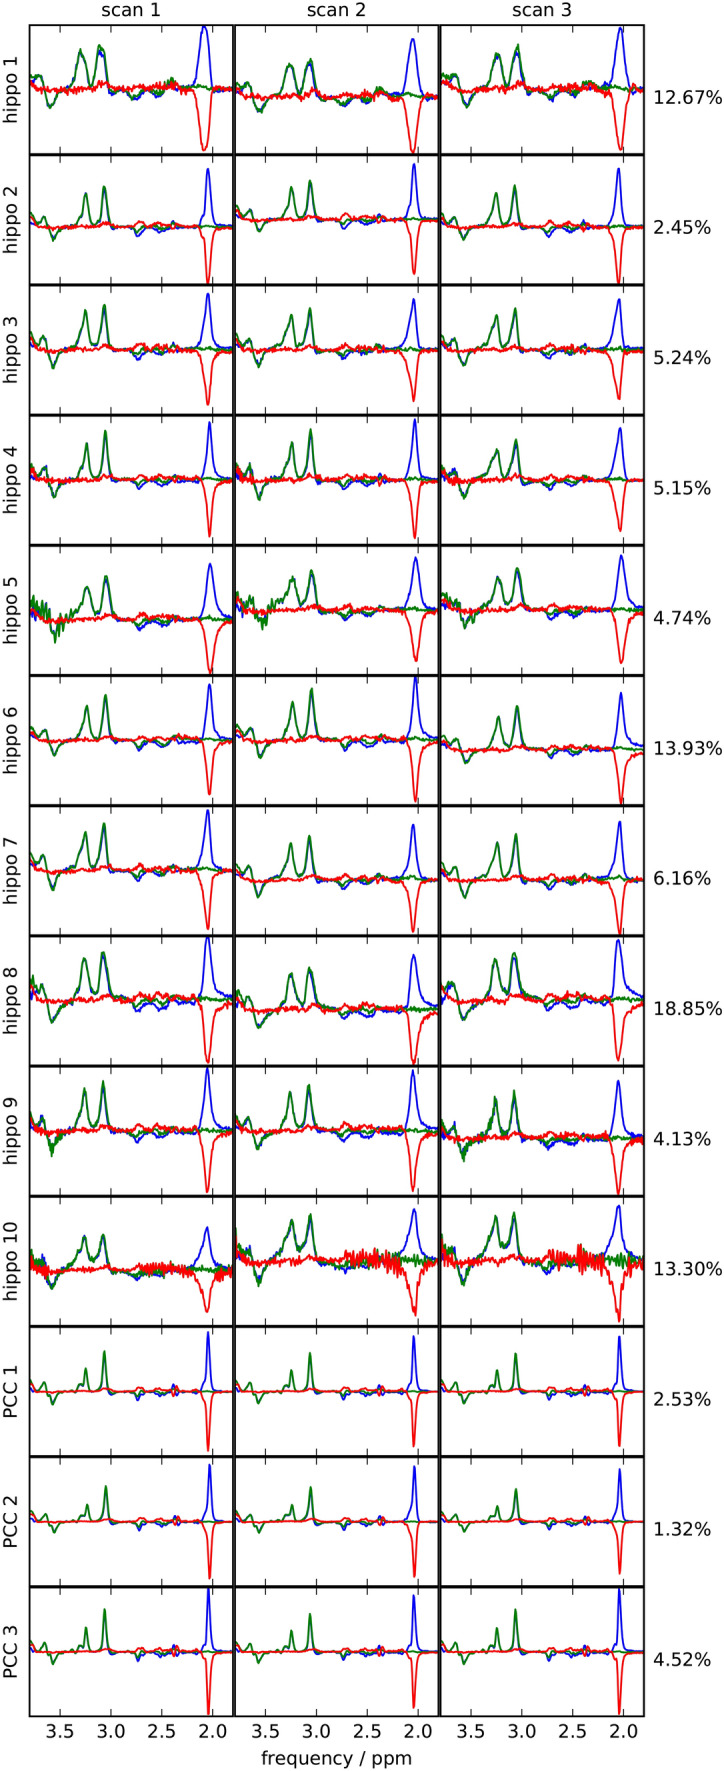
Edited, unedited and difference spectra of all measurements of hippocampus study (10 subjects) and the PCC study (3 subjects). Right to the plots, the intra-session CoV of the GABA+/ total creatine ratio in the respective subject

Edited, unedited and difference spectra of all measurements of hippocampus study (10 subjects) and the PCC study (3 subjects). Right to the plots, the intra-session CoV of the GABA+/ total creatine ratio in the respective subject