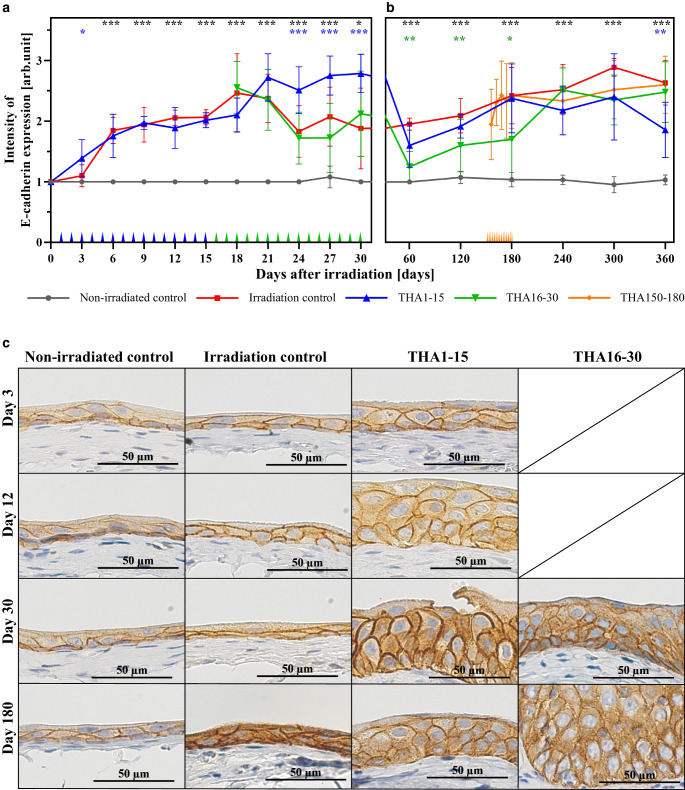
Fig. 1.
Effect of irradiation at day 0 on E‑cadherin expression and its modulation by thalidomide (THA): a Early phase: Data points at 3‑day intervals represent the average immunohistochemical intensity (IHC) score from 15 samples (5 samples per day). b Late phase: Data points at 60-day intervals represent the average IHC score from 12 samples (6 samples every 30 days). Additional data points at 6‑day intervals are shown in the THA150–180 group and represent the average IHC score from 18 samples (6 samples every other day). Significant differences between THA treatment groups and irradiated control are marked with stars in the color of the respective treatment group. Different THA treatment times are marked in the color of the respective group along the x‑axis (daily application in THA1–15 and THA16–30; every second day in THA150–180). c Representative photomicrographs of urothelium at 400× magnification at day 3, 12, 30 and 180 demonstrate changes in intensity of immunoreactivity for E‑cadherin. *p ≤ 0.05; **p ≤ 0.01; ***p ≤ 0.001; scale bar = 50 µm

