Figure 1.

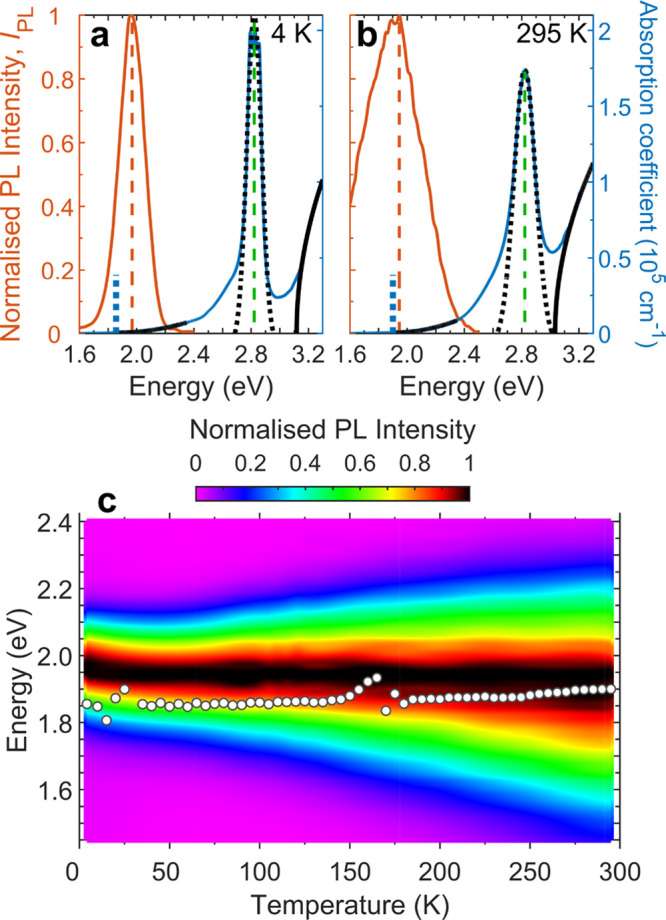
Temperature-dependent absorption and PL spectra of Cs2AgBiBr6. (a) Steady-state PL (solid red line) and absorption spectra (solid blue line) at 4 K as a function of photon energy for a Cs2AgBiBr6 thin film. A Gaussian fit to the excitonic absorption peak at around 2.8 eV is plotted as a dotted black line, with its central energy corresponding to the dashed green line. The dashed red line indicates the energy at the maximum PL intensity. Quadratic and square-root fits to the lower-energy indirect absorption onset and higher-energy direct absorption onset respectively are plotted as solid black lines. Close-up views of the absorption spectrum in the regions of the fits are shown in Figure S1. The dotted blue line indicates Egi, which provides an estimate of the indirect band gap energy from the quadratic fit. (b) Corresponding spectra and fits at 295 K. (c) Color plot of the normalized PL spectra at temperatures between 4 and 295 K. The white circles show Egi as a function of temperature.
