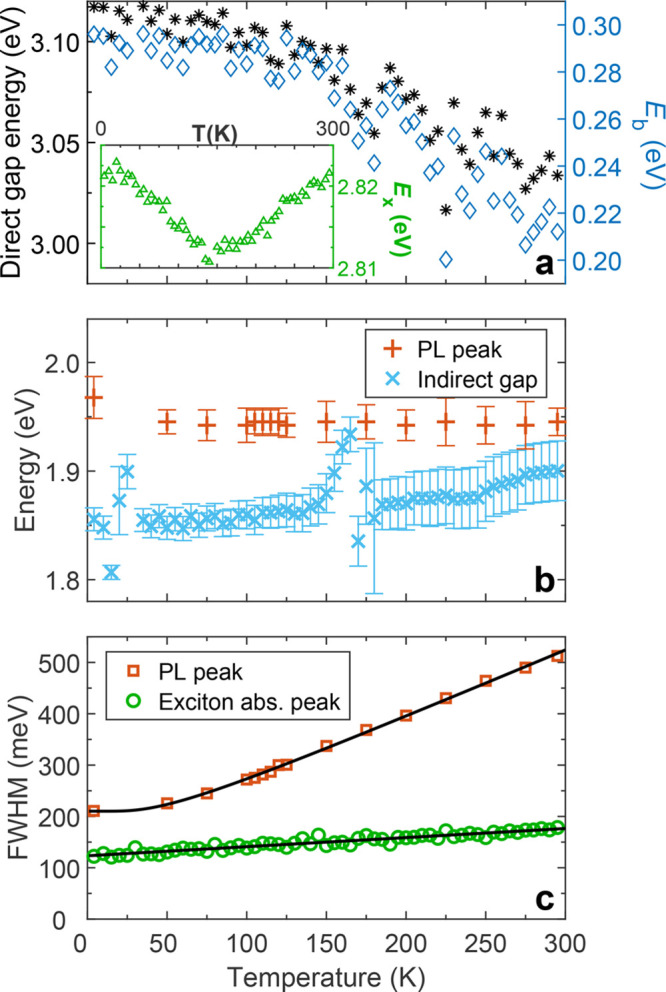
Figure 2.

Temperature-dependence of transition energies and peak widths of Cs2AgBiBr6. (a) Direct band gap energy (black asterisks, left axis) and direct exciton binding energy (Eb, blue diamonds, right axis) of Cs2AgBiBr6 as a function of temperature, as obtained from fits to absorption spectra. The inset shows the temperature dependence of the direct exciton energy (Ex, green triangles), obtained from Gaussian fits to the peak evident in absorption spectra. (b) Temperature dependence of the peak of the PL spectra (red plus signs) and the indirect band gap energy (light blue crosses) as determined from the absorption spectra. (c) Temperature-dependent line width (full width at half-maximum, FWHM) of the PL peak (red squares) and excitonic absorption peak (green circles). The solid black lines are fits that account for Fröhlich coupling with LO phonons, as described in the main text.
