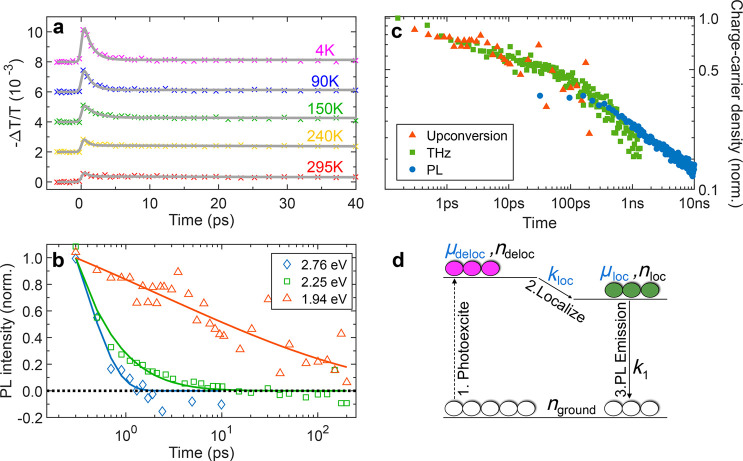
Figure 3.
Dynamics of charge-carrier localization in Cs2AgBiBr6. (a) OPTP photoconductivity transients for a Cs2AgBiBr6 thin film, measured at the temperatures shown in the legend under an excitation fluence of 10.1 μ J cm–2. For clarity, transients at successively decreasing temperatures are offset vertically by 2 × 10⁻³. The gray lines depict fits based on a two-level charge-carrier mobility model, as described in the main text. (b) Room-temperature normalized PL upconversion transients measured at 2.76 eV (blue diamonds), 2.25 eV (green squares), and 1.94 eV (red triangles). The solid lines are stretched exponential fits to the transients (empty markers) of the corresponding colors. The dotted black line indicates zero intensity; negative intensities are an artifact of background subtraction. (c) Time dependence of charge-carrier density, n, after photoexcitation, as derived from OPTP photoconductivity (green squares), PL upconversion (red triangles), and TCSPC (blue circles) measurements. The latter two transients are scaled to line up with the terahertz transient, which is normalized at its maximum intensity point. (d) Schematic of the two-level mobility model used to fit the OPTP decays in (a). The fixed parameters are shown in black, while parameters that are fitted and extracted from the model are shown in blue. After being initially photoexcited to the delocalized state (pink), the charge carriers localize to the localized state (green) before recombining.

