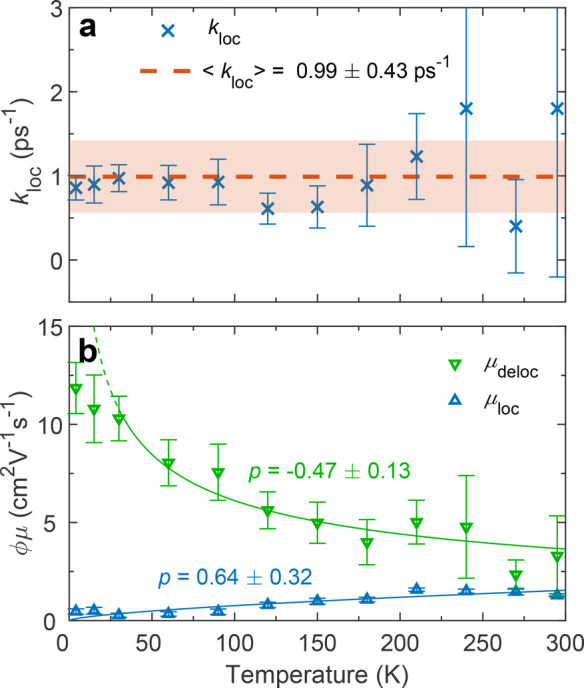
Figure 4.

Charge-carrier mobility changes indicative of excited-state localization. (a) Temperature dependence of the localization rate (kloc, blue crosses) within the two-state mobility model for Cs2AgBiBr6. The red dashed line indicates the mean value, with its uncertainty represented by the red shaded area. (b) Temperature dependence of the effective charge-carrier mobilities associated with the delocalized (μdeloc, green) and localized (μloc, blue) states. Power-law fits are plotted as solid lines in the corresponding colors, with their exponents (p) displayed alongside. The data points for μdeloc at the lowest two temperatures were not included in the fit as the power-law model becomes unphysical in this region, indicated by the dashed green line. The mobilities are “effective” since the photon-to-charge branching ratio, ϕ, is not necessarily 1.
