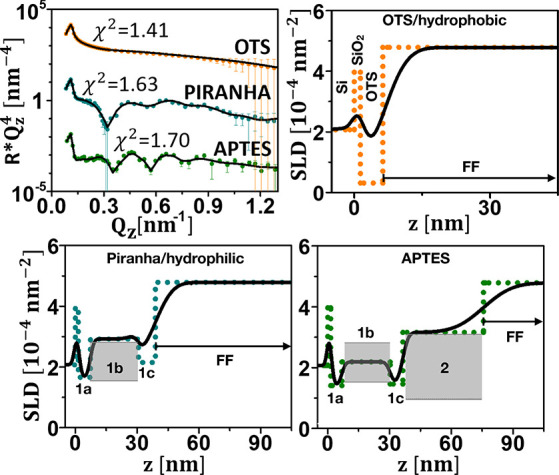
Figure 4.

Upper left panel: NR ( ) plotted as a function of Qz for FF25 (5 vol %) measured against
hydrophilic (piranha), hydrophobic (OTS), and APTES-coated Si. The
solid lines represent fits to the data. Other panels: profile of nuclear
SLD plotted as a function of distance from the Si (100) surface. Also
included are the SLD values for the close-packed particle layers (gray
areas). The dots show the SLD profile assuming zero roughness to aid
identification of the distinctive layers, as defined in Figure 3. In the upper right panel
the substrate, SiO2, and OTS layers are indicated as well.
Error bars represent the statistical uncertainties propagated through
the data normalization and with a one sigma confidence interval.
