
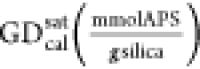
Table 2. Number of Silanol Groups and the Calculated and Experimental Values of APS Grafting Density at Three Reaction Temperatures.
| reaction temperature |  |
 |
TGA mass loss (%) | 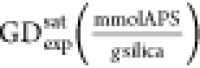 |
 |
|---|---|---|---|---|---|
| 150 °C | 2.56 ± 0.07 | 0.85 ± 0.02 | 5.2 ± 0.8 | 0.97 ± 0.03 | 2.92 ± 0.09a |
| 200 °C | 1.79 ± 0.03 | 0.59 ± 0.01 | 3.6 ± 0.2 | 0.51 ± 0.02 | 1.54 ± 0.06 |
| 250 °C | 1.05 ± 0.03 | 0.35 ± 0.01 | 3.8 ± 0.3 | 0.52 ± 0.02 | 1.57 ± 0.06 |
a
Since saturation was not achieved at 150 °C, the maximum achieved GD (10 min pulse time) is reported here.