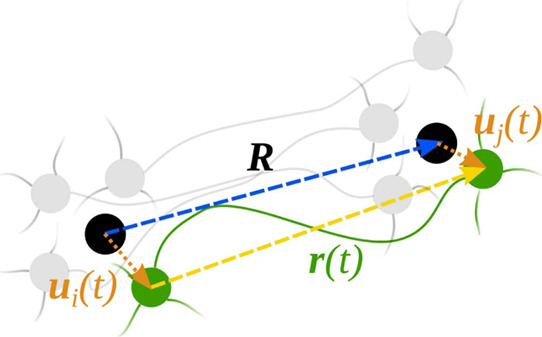
Figure 1.

Cartoon providing a visual explanation of some of the quantities used throughout the text. In the cartoon, the black dots are the average positions of two cross-linkers i and j, the green dots are their instantaneous positions at time t, and the gray dots are their positions at some other times. The time-averaged end-to-end vector R is the vector connecting the black dots, the instantaneous end-to-end vector r(t) is the vector connecting the green dots, and its instantaneous fluctuation is the difference between the instantaneous fluctuations of the positions of the two cross-linkers, ui(t) and uj(t).
