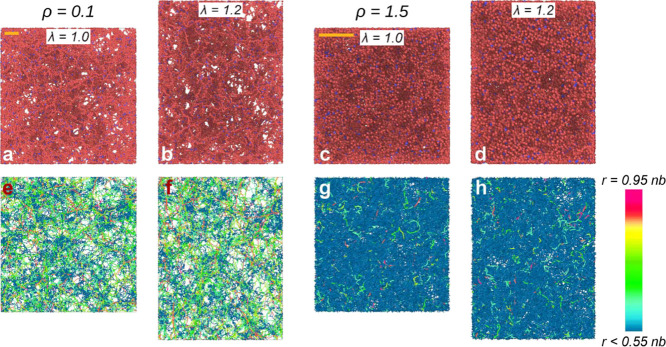
Figure 3.
Snapshots of a network with cross-linker concentration C = 5% and assembly density ρinit = 0.1 simulated at (a, b, e, and f) ρ = 0.1 and (c, d, g, and h) ρ = 1.5. We show configurations in equilibrium (a, c, e, and g) and subject to a uniaxial deformation along the vertical direction with λ = 1.2 (b, d, f, and h). Top row (panels a–d): turquoise and red particles indicate cross-linkers and monomers, respectively. The orange scale bars in the top left corners are 10σ long. Bottom row (panels e–h): the same configurations are represented in a way such that the chains are colored according to the ratio between their end-to-end distance and contour length (see the legend on the right).

