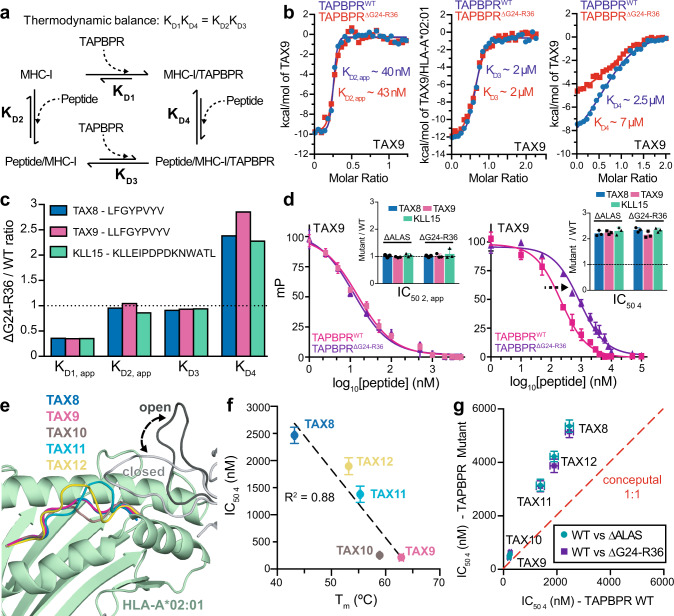
Fig. 5. The TAPBPR G24-R36 loop promotes peptide binding on empty MHC-I.
a Schematic of the TAPBPR-mediated MHC-I peptide exchange cycle. The dissociation constant (KD) of each step is noted. b ITC performed at different stages of the peptide exchange cycle (KD2, KD3, KD4) for TAX9/HLA-A*02:01/hβ2m with TAPBPRWT or TAPBPR∆G24-R36 (see “Methods”). KD1 was not measured directly, but inferred from thermodynamic balance along the cycle shown in (a). Due to experimental limitations, the measured KD1 and KD2 are “apparent” and thus denoted with KD1,app and KD2,app. KD and n values determined by ITC are noted in Table 1. c Apparent KD ratios determined by ITC for TAPBPR∆G24-R36/TAPBPRWT for TAX8, TAX9, and KLL15 peptides. The dotted line represents no effect. d FP performed under substoichiometric (left) and stoichiometric (right) conditions. Millipolarization (mP) values are plotted as a function of the log10 peptide concentration for TAX8, TAX9, and KLL15 competitor peptides. The insets show a comparison of the ratio of FP-determined IC50 values for TAPBPR∆G24-R36 or TAPBPR∆ALAS versus TAPBPRWT. The dotted line represents no effect. e X-ray structures (TAX8, TAX9) and RosettaCM models (TAX10, TAX11, TAX12) show peptide bulging within the HLA-A*02:01 groove. The open and closed conformation of the TAPBPR G24-R36 loop from MD simulations are shown in gray and black, respectively. f Comparison of FP-determined IC50 values under stoichiometric conditions for TAX length variants versus pMHC-I thermal stability. The R2 value of the linear regression fit (black line) is shown. g Comparison of FP-determined IC50 values under stoichiometric conditions for TAX length variants for TAPBPRWT versus TAPBPR∆ALAS or TAPBPR∆G24-R36. The dotted red line represents a conceptual 1:1 correlation (no effect). Data presented in panels (d), (f), and (g) are mean ± SD for n = 3 independent experimental replicates.

