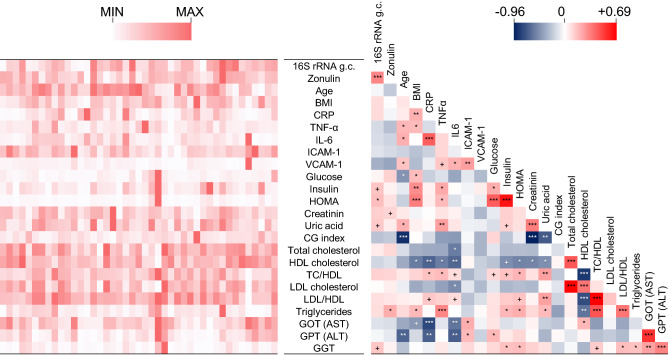
Figure 2.
Correlations between bacterial DNAemia, age, BMI, and metabolic and functional markers determined in blood of the older subjects under study (n = 43). The heatmaps on the left (white-red color gradient) refers to the distribution among older subject of the item reported in the central column. The heatmap on the right (blue-white-red color gradient) represents the Spearman’s correlation coefficient, ρ. Asterisks indicate the Kendall rank correlation P value: ***P < 0.001; **P < 0.01; *P < 0.05; + , 0.05 < P ≤ 0.10.

