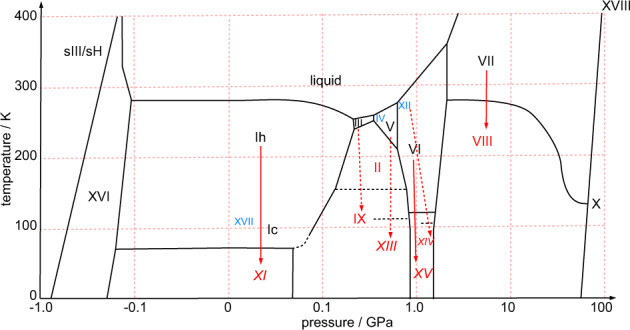
Fig. 1. Schematic phase diagram of crystalline ice phases inspired by Bartels-Rausch et al.1, Salzmann et al.18 and Huang et al.21.

Phases labeled with black Roman numerals are hydrogen-disordered phases; those labeled with red numerals are hydrogen-ordered phases; those labeled with blue numerals are metastable phases. The red solid arrows represent direct disorder-order transitions. The red dotted arrows represent disorder-order transitions that cross the stability range of another phase.
