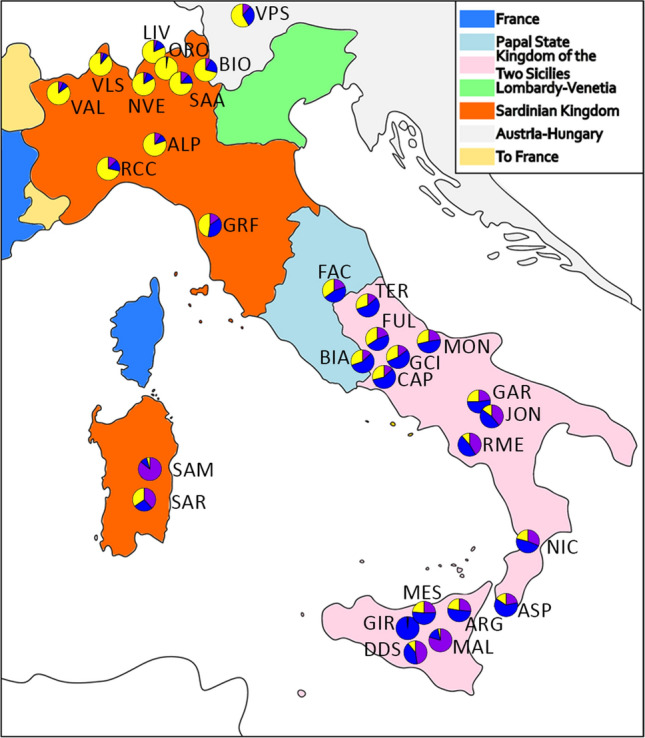
Figure 2.

Historical map of Italy pre-unification with pie chart of the ADMIXTURE K = 3 values plotted on the geographical coordinates of the mean sampling location of each breed. The colours reflect the ADMIXTURE component associated with the Maltese (purple), Northern Italy Cluster (yellow), and Central-Southern Cluster (blue). BEZ and MXS were not represented due to the lack of specific geographic coordinates. MNT_I and MNT_M were excluded as extreme outliers. Map was generated in Inkscape v1.0 (https://inkscape.org/); the pie charts were created using R21.
