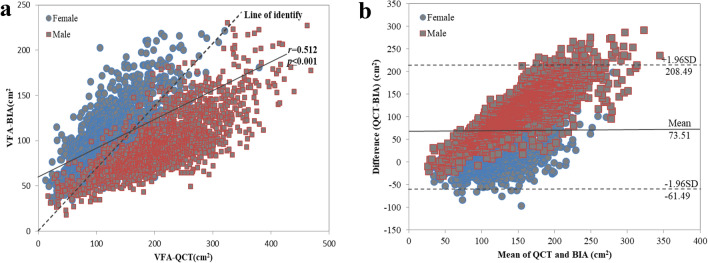
Figure 1.
The association and consistency of VFA measured by QCT and BIA. (a) Scatter plot of VFA measured by QCT and BIA. VFA estimated by BIA had significantly positive correlation with that of the QCT method (r = 0.512, P < 0.001). (b) Bland–Altman plot of difference in VFA (QCT measurement minus BIA measurement) against the mean of two measurements. The middle line denotes bias (mean difference between the two measurements), and dashed lines denote 95% limits of agreement (1.96 SD of the difference, bias: 73.51, 95% LOA: − 61.49 to 208.49).

