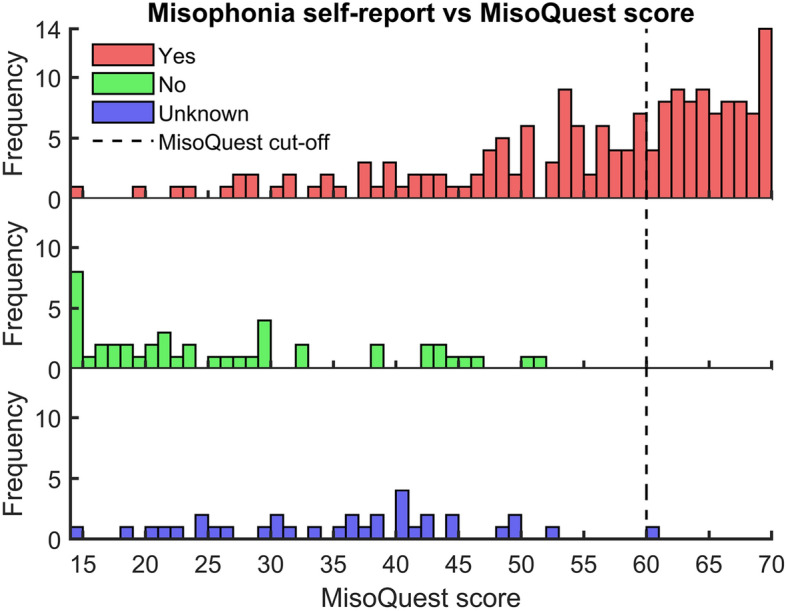
Figure 1.

Misophonia self-report vs MisoQuest score histograms. Frequency of MisoQuest scores for subjects answering “yes”, “no”, and “I don’t know” to self-report of misophonia are shown in red, green, and blue, respectively. The MisoQuest diagnostic cut-off (= 61) is shown with a black dotted line. Histogram bins contain the upper values of bin edges (e.g., the subject with the highest score in the bottom plot had a value of 61), as such the cut-off is drawn at x = 60.
