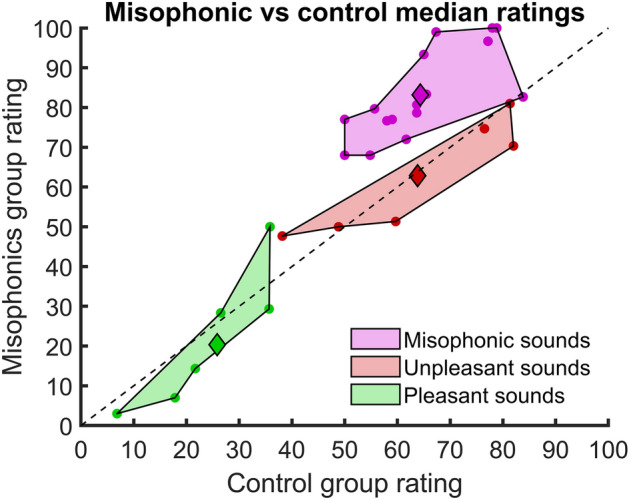
Figure 3.

Misophonic vs Control median ratings for each sound. Ratings vary between 0 (Pleasant) and 100 (Unpleasant). Each dot represents the median rating of a sound for the control (x-axis) group and the misophonic (y-axis) group. Sounds are colored and grouped as misophonic (magenta), unpleasant (red), and pleasant (green), as determined initially during the choice of the stimuli (Table 1). The median of individual medians of sound ratings within the same category is shown as a diamond. As a visual reference, the line is drawn in dotted black. Sounds close to this line have similar ratings for the two groups.
