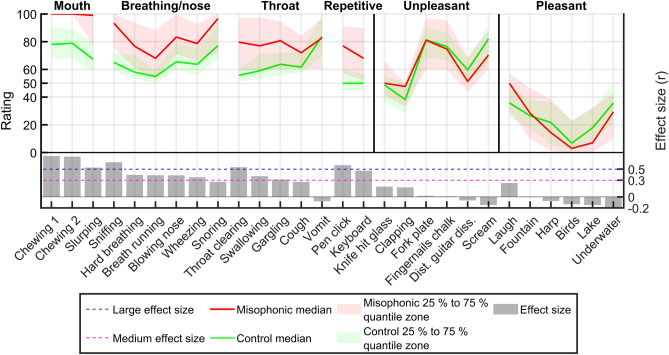
Figure 4.
Ratings and effect sizes for each sound. Each sound is shown on the x axis. They are ordered by category (misophonic, unpleasant, and pleasant), subcategory for the misophonic sounds (mouth, breathing/nose, throat, and repetitive), and by decreasing effect size within each (sub)category. The left y axis represents sound ratings, which vary between 0 (highly pleasant) and 100 (highly unpleasant). Control and misophonic medians and 25% to 75% quantiles, are indicated in green and red, respectively. The right y axis represents the effect size (r). Large and medium effect sizes (r = 0.5 and 0.3) are shown as blue and magenta horizontal lines, respectively. Each sound’s effect size is shown as a grey bar plot. Dist. Distorted, diss. dissonance.

