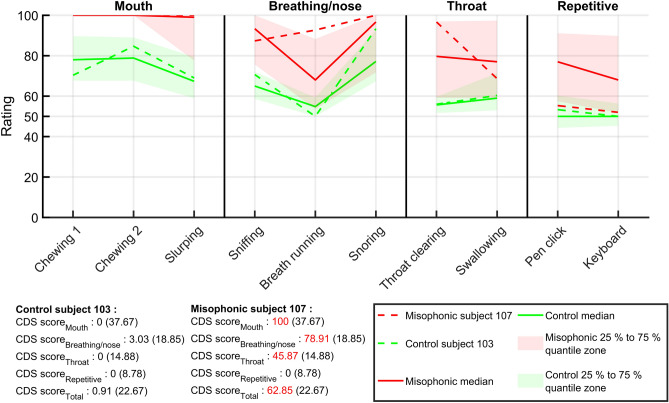
Figure 6.
CDSMiso ratings. Each CDS is shown on the x axis. They are ordered by subcategory (mouth, breathing/nose, throat, and repetitive), and by decreasing effect size within each subcategory. The left y axis represents sound ratings, which vary between 0 (highly pleasant) and 100 (highly unpleasant). Control and misophonic medians and 25% to 75% quantiles, are indicated in green and red, respectively. Control and misophonic individual examples are indicated by dotted lines. The CDS scores are colored in red if they are above (or equal to) respective cut-off values (in brackets).

