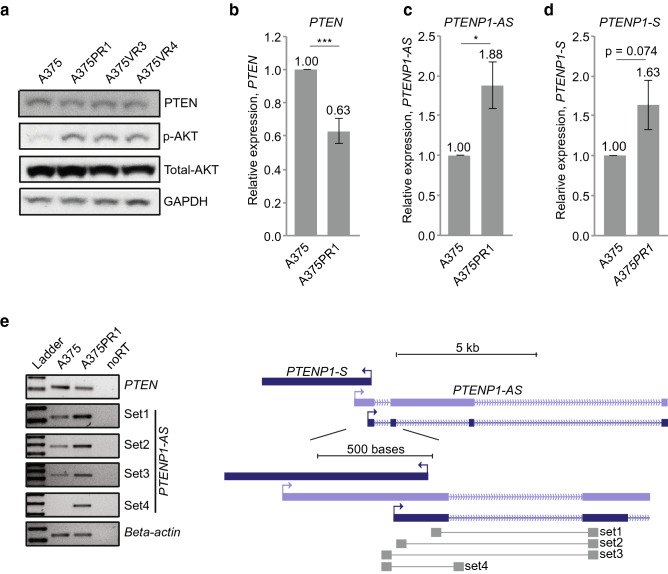
Figure 1.
Expression levels of PTEN and PTENP1-lncRNAs in BRAFi sensitive and resistant cell lines. (a) Western blot analysis presenting the expression of PTEN, total AKT and p-AKT in A375 and the BRAFi resistant sublines. (b–d) qRTPCR analysis of (b) PTEN, (c) PTENP1-AS and (d) PTENP1-S in A375 and the BRAFi resistant A375PR1 subline (n = 3, p-values represent a two-tailed student’s t-test). (e) Semi-qRTPCR assay showing different isoforms of the PTENP1-AS transcripts with a scheme showing primer binding sites.

