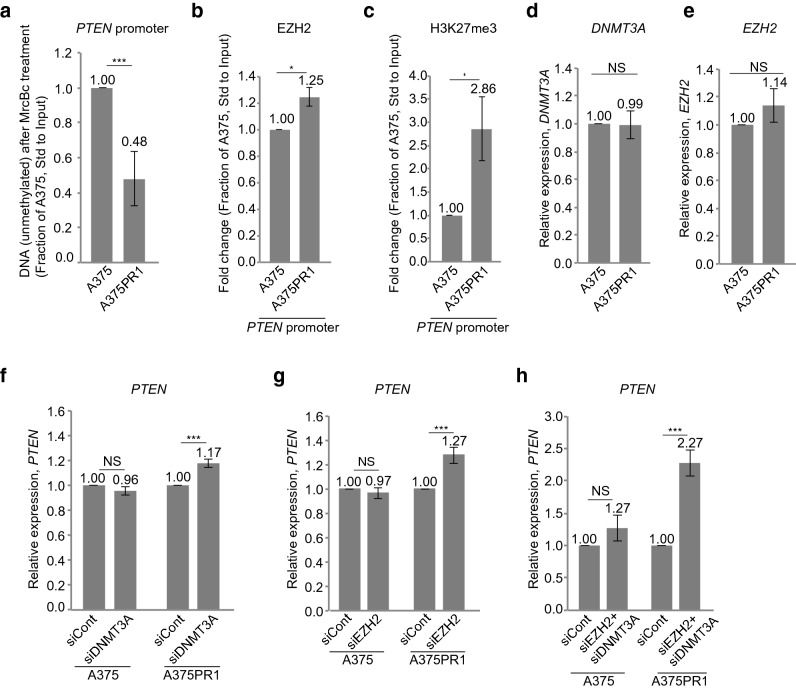
Figure 3.
Characterization of the PTEN promoter in A375 and A375PR1 cell lines. (a) qRTPCR measuring PTEN promoter CpG methylation, as determined by the remaining (unmethylated) DNA upon treatment with the methyl-cytosine-specific restriction enzyme McrBc (n = 3). (b–c) ChIP followed by qRTPCR analysis measuring the levels of (b) EZH2 and (c) H3K27me3 at the PTEN promoter in A375 and A375PR1 cell lines (n = 3). (d–e) qRTPCR measuring baseline expression levels of (d) DNMT3A and (e) EZH2 in A375 and A375PR1 cell lines (n = 3). (f–g) qRTPCR measuring the expression levels of PTEN following siRNA induced knockdown of (f) DNMT3A and (g) EZH2 in A375 and A375PR1 cell lines (n > 3). (h) qRTPCR measuring the expression levels of PTEN following simultaneous siRNA-induced knockdown of EZH2 and DNMT3A in A375 and A375PR1 cell lines (n = 3). (a–h; p-values represent a two-tailed student’s t-test).

