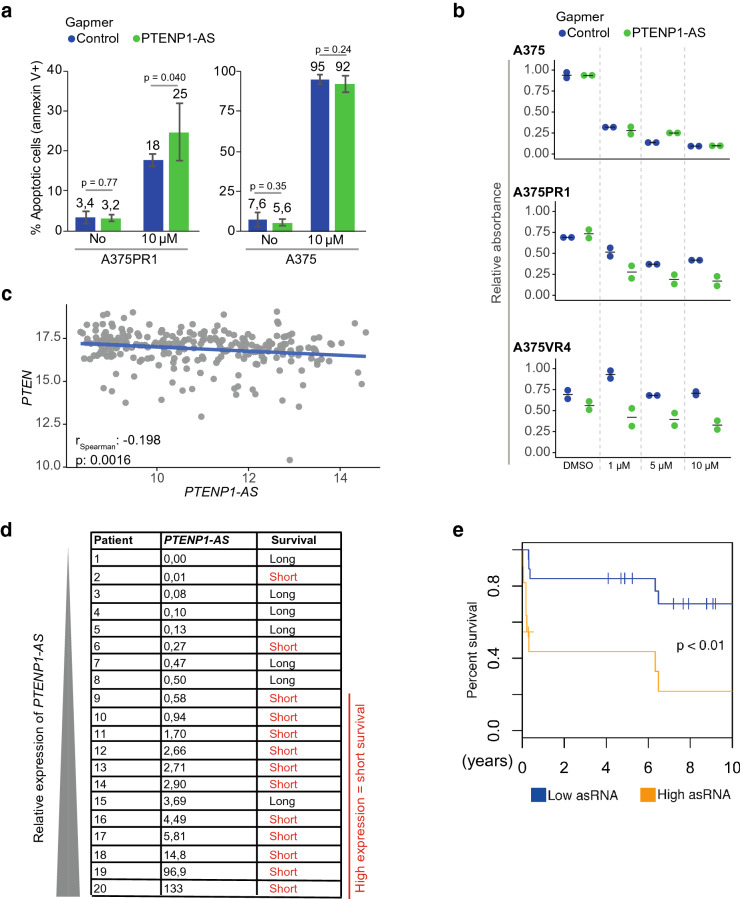
Figure 5.
Manipulation of PTENP1-AS in BRAFi resistant sublines and evaluation of PTENP1-AS in metastatic melanoma samples. (a) Cell-death analysis by annexin V and propidium iodide staining upon knockdown of PTENP1-AS and vemurafenib treatment (n = 6). (b) Colony formation assays for A375, A375PR1 and A375VR4 cell lines measuring relative absorbance of crystal violet solution stained colonies upon gapmer ASO-induced knockdown of PTENP1-AS co-treated with various concentrations of vemurafenib. (c) Expression data (TCGA) for PTEN and PTENP1-AS from melanoma samples. (d) qRTPCR measuring expression levels of PTENP1-AS in a set of 20 first regional lymph node metastases from stage III melanoma patients. Based on clinical follow up data, the patients were categorized as long- or short-term survivors, > 60 months or ≤ 13 months, respectively. (e) Kaplan–Meier plot showing overall survival for patients with high (n = 12) or low (n = 17) expression levels of PTENP1-AS. Expression levels of PTENP1-AS was measured in first regional lymph node metastases from an independent set of 29 stage III melanoma patients using qRTPCR. The p-value represents a log-rank test.

