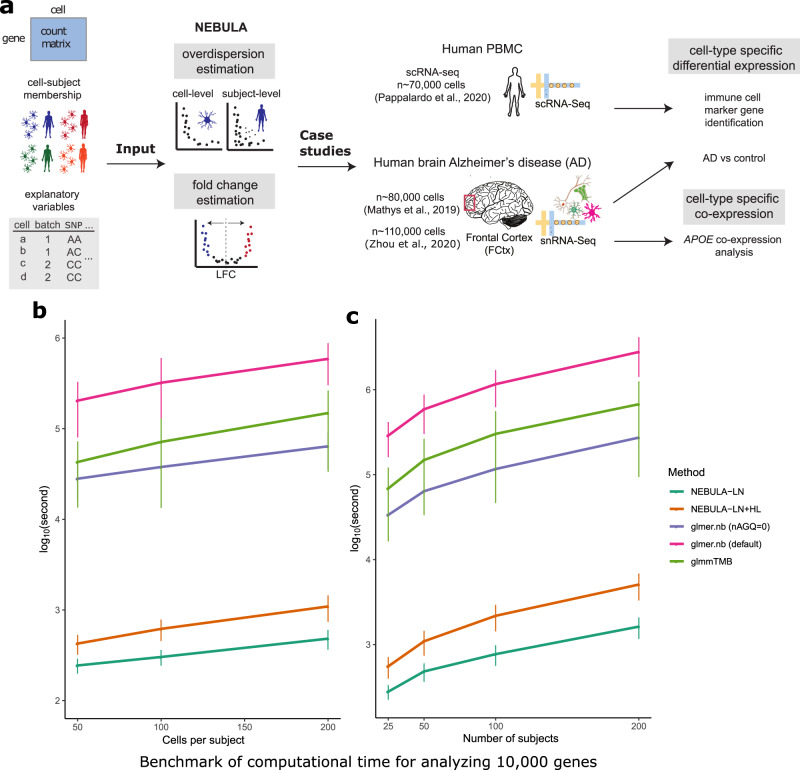
Fig. 1. Overview of the input, output, and computational efficiency of NEBULA.
a A flowchart of NEBULA including the input data, the major estimation steps in NEBULA, and the analyses that were conducted using NEBULA in the application to the real data5,27,78. b The computational time (measured in log10(seconds)) of fitting an NBMM for 10,000 genes with respect to CPS by NEBULA, glmer.nb18, and glmmTMB19. The number of subjects was set at 50. c The computational time (measured in log10(seconds)) of fitting an NBMM for 10,000 genes with respect to the number of subjects. The error bars represent one standard deviation of n = 10,000 genes. The CPS value was set at 200. Two fixed-effects predictors were included in the NBMM. The average benchmarks were summarized from scenarios of varying subject-level and cell-level overdispersions and the CPC value of a gene ranging from exp(−4) to 1. CPS: cells per subject. CPC: counts per cell.

