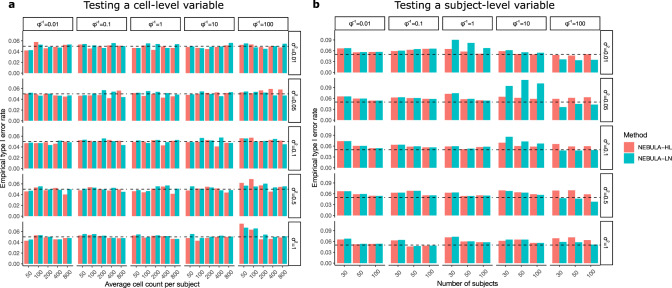
Fig. 3. Empirical type I error rate of testing cell-level and subject-level variables using NEBULA-LN and NEBULA-HL.
a The empirical type I error rate of testing a cell-level variable using NEBULA-LN (blue) and NEBULA-HL (red) under different combinations of CPS, , and . The number of subjects was set at 50. b The empirical type I error rate of testing a subject-level variable using NEBULA-LN (blue) and NEBULA-HL (red) under different combinations of the number of subjects, , and . The CPS value was set at 400. The type I error rate was calculated from n = 500 simulated replicates in each of the scenarios and was evaluated at the significance level of 0.05 (the dashed lines). We used the higher-order Laplace approximation in NEBULA-HL for scenarios of low CPC. CPS: cells per subject. CPC: counts per cell.

