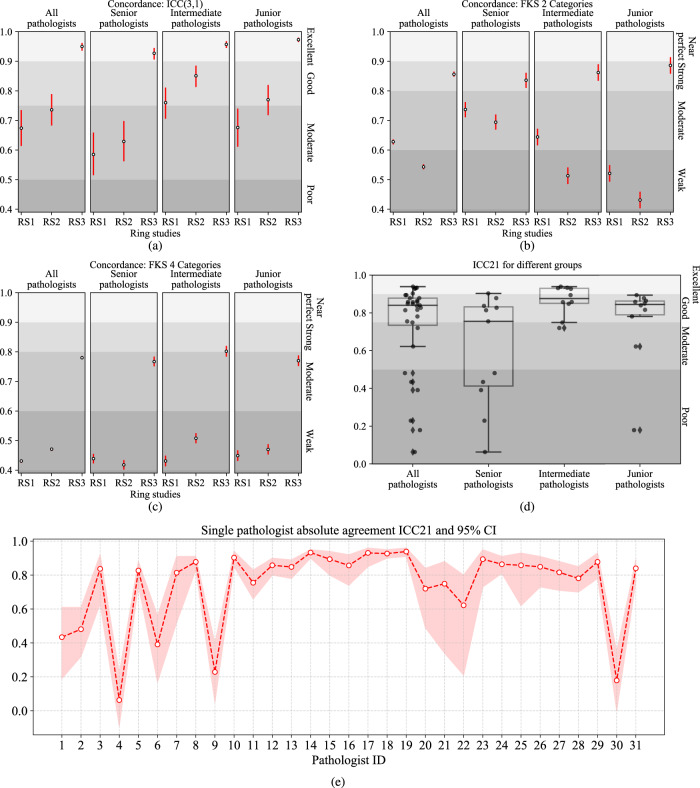
Fig. 3. The concordance of IC scoring.
The white and black circles indicate the values, and the red bars indicate a 95% confidence interval. a Continuous concordances ICC31 in three-ring studies. b The FKS concordances for a 2-category score. c The FKS concordances for a 4-category score. d Boxplots of intra-pathologist concordances ICC21 between RS1 and RS2 for all and three levels of pathologists. The center bar of each box represents the median value, and the box body extends from the 25th to the 75th percentile of values in one group. Black circles indicate the ICC21 of the individual pathologists, and black diamonds indicate the outliers. e Intra-pathologist concordances ICC21 for individual pathologists between RS1 and RS2. The shadow area indicates the 95% CI.

