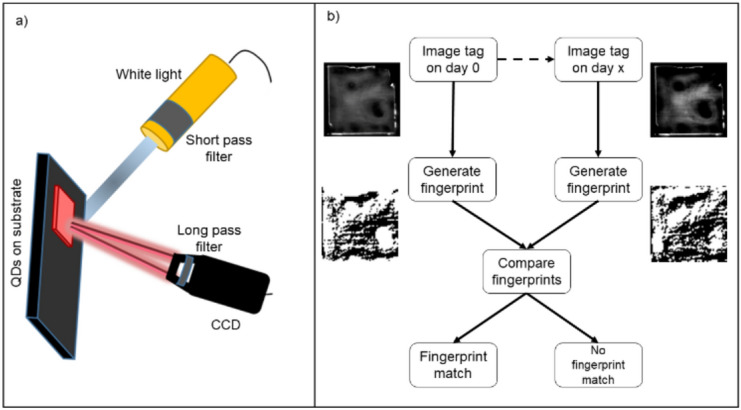
Figure 1.

(a) A schematic of the apparatus used to measure PL intensity maps and to captures images of each token. The quantum dots in each token were excited using white light filtered through a 450 nm short-pass filter. A 500 nm long-pass filter placed in front of the CCD ensures only light from the emission of the QD-PUF is measured. The entire apparatus is sealed within a closed black box when measurements are in progress. (b) Using the apparatus in (a) each token is imaged on the day of its creation and each subsequent day after. The fingerprint generated on the subsequent days is compared to that of day 0 to determine if it matches the original fingerprint.
