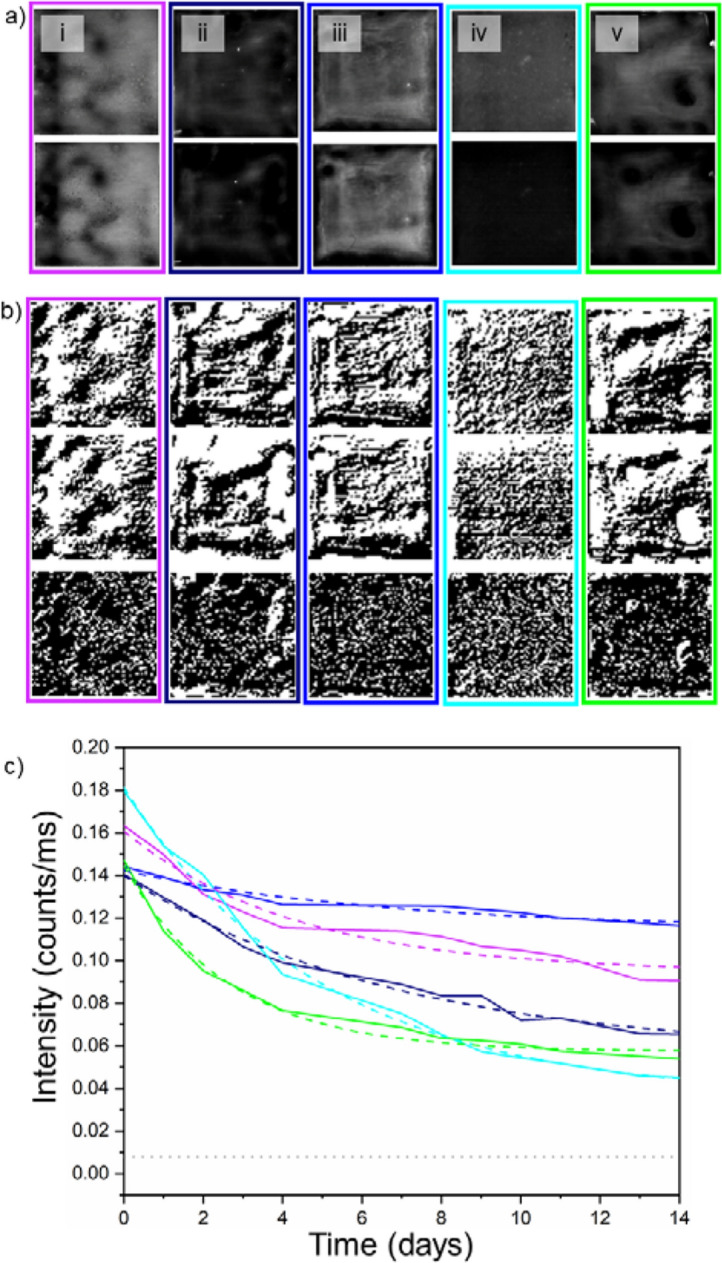
Figure 2.

(a) Top—Images showing photoluminescence (PL) intensity maps from each formulation of the Group 1 tokens captured on the day they were created (day 0). Bottom—PL images of each Group 1 token type captured on day 14. The intensity of day 14 images has been increased by 30% post-capture to aid visual comparison. (i) PMMA, (ii) PMS, (iii) PS, (iv) PVDF, (v) SEBS. (b) The top of each coloured rectangle is the R-LBP generated fingerprint of the labelled QD-PUF on day 0. The middle of each coloured rectangle is the fingerprint from day 14. In the bottom image of each rectangle, the white pixels indicate the pixels that changed in value in the fingerprint between day 1 and 14. The percentage of pixels that changed value and the composition of each is as follows: (i) PMMA, 21.2%, (ii) PMS, 24.5%, (iii) PS, 18.9%, (iv) PVDF, 29.1% (v) SEBS, 19.3%. (c) A plot showing the average PL intensity from each token type as a function of time since their creation. An exponential decay fit was applied to each (dashed line). The grey dotted line represents the background noise signal from the CCD-sensor.
