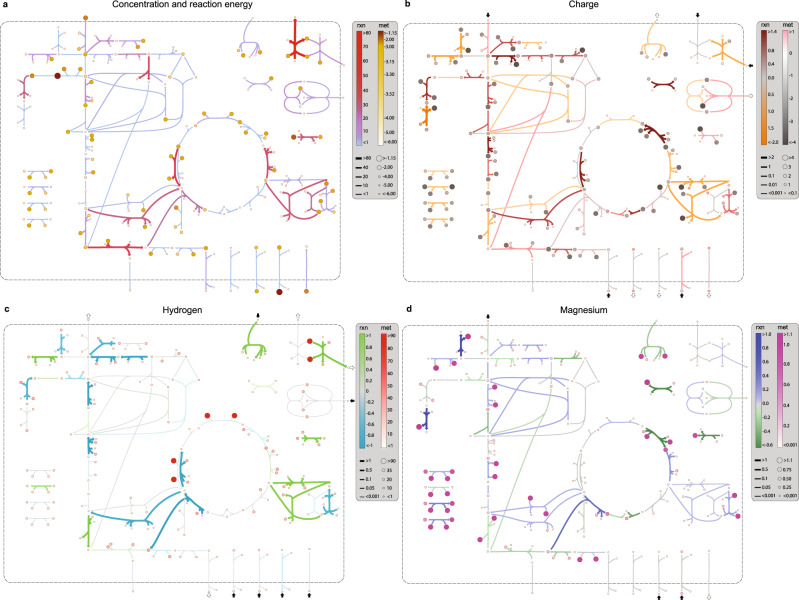
Fig. 4. The ABC-based analysis elucidates the distinct ways, in which biochemical reactions perturb the physicochemical state of the cell.
Computations are performed for exponential growth on glucose under physiological conditions (pHp = 7, pHc = 7.5, [Mg]c = 2 mM, Ic = 300 mM). a Concentration and energy map: reaction colorbar indicates transformed Gibbs energy of reactions in kJ/mol-rxn and metabolite colorbar indicates log10(Ci/Co) with Co = 1 M. b Charge map: reaction colorbar indicates intrinsic charge consumption in mol-e/mol-rxn and metabolite colorbar indicates metabolite effective charge in mol-e/mol-met. c Hydrogen map: reaction colorbar indicates intrinsic hydrogen consumption in mol-H/mol-rxn and metabolite colorbar indicates metabolite hydrogen content in mol-H/mol-met. d Magnesium map: reaction colorbar indicates intrinsic magnesium consumption in mol-Mg/mol-rxn and metabolite colorbar indicates metabolite magnesium content in mol-Mg/mol-met. Metabolite and reaction colorbars are denoted by “met” and “rxn”, respectively. For b–d, arrows point in the direction, in which negative charge, hydrogen, and magnesium ions are consumed. Reaction charge, hydrogen, and magnesium consumption for transport reactions, as indicated by the colorbars, do not reflect translocated hydrogen ions. Small arrows next to each transport reaction show the direction of their respective net fluxes into and out of the cell, accounting for translocated hydrogen ions and the accompanying metabolites. Enlarged and detailed maps are provided in Supplementary Figs. S8–S11. The definitions of reaction charge, hydrogen, and magnesium consumption are given in “Abiotic constraints” section.

