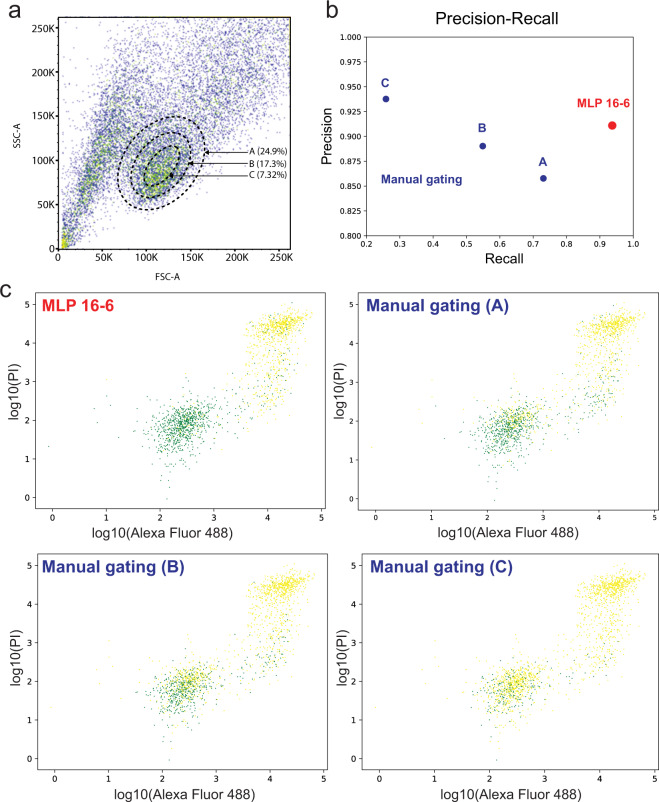
Fig. 4. Comparison between the MLP 16-6-based and manual gating.
a Manual gating of “live” cells using SSC-A and FSC-A. Three gates of different size were included and the percentage of “live” cells for each gate was calculated. b Comparison of precisions and recalls of live cell predictions between the MLP 16-6-based and conventional gating methods. c Classifications of live (green) and apoptotic (yellow) cells using manual gating and MLP 16-6-based gating. The x-axis denotes log10(Alexa Fluor 488), and the y-axis denotes log10(PI).

