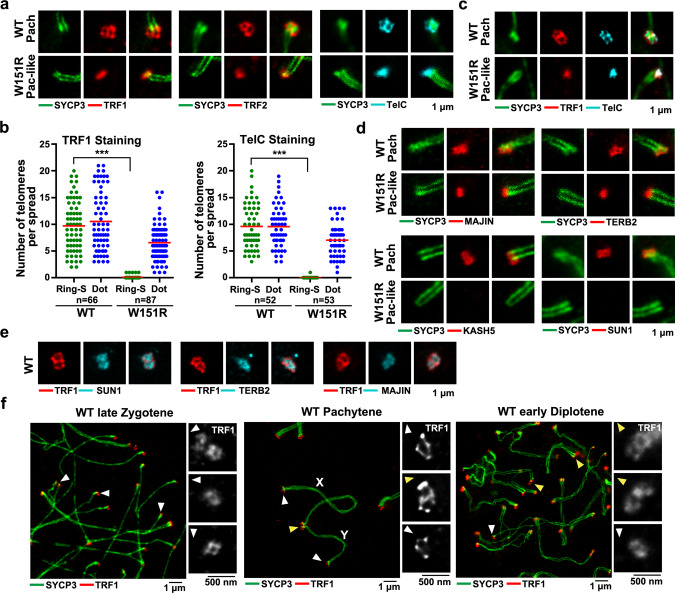
Fig. 6. The SUN1–SPDYA interaction is required for telomere structures on the NE.
a IF analysis by STED of spermatocyte spreads stained for SYCP3 (green) and TRF1 (red), TRF2 (red), or telomeric DNA (telC, cyan). Scale bar, 1 μm. (Pach pachytene). b Quantification of the number of ring and figure-eight-like TRF1 and TelC structures per spread STED image from panel a. In each spermatocyte spread, only a subset of telomeres can be imaged. Ring-S, ring or figure-eight-like structures. Dot, focal structures. A total of n = 66 WT (for TRF1), n = 87 W151R (for TRF1), n = 52 WT (for TelC), and n = 53 W151R (for TelC) spermatocyte spreads were counted. Red lines indicated the mean values. A two-sided Student’s t test was performed, ***P = 7.3E-42 (TRF1) and ***P = 8.9E-31 (TelC). c IF-FISH analysis by STED of spermatocyte spreads stained for SYCP3 (green), TRF1 (red), and telomeric DNA (telC, cyan). Scale bar, 1 μm. d IF analysis by STED of spermatocyte spreads stained for SYCP3 (green) and MAJIN (red), TERB2 (red), KASH5 (red), SUN1 (red). Scale bar, 1 μm. e IF analysis by STED of spermatocyte spreads stained for TRF1 (red) together with SUN1 (cyan), TERB2 (cyan) or MAJIN (cyan). Scale bar, 1 μm. f IF analysis by STED of WT chromosome spreads stained for SYCP3 (green) and TRF1 (red). Insets show TRF1 ring structures at asynapsed telomeres (white arrowheads) and figure-eight-like structures at synapsed telomeres (yellow arrowheads), respectively. X and Y indicate chromosomes X and Y, respectively. Scale bars, 1 μm; 500 nm (insets). Source data are provided as a Source Data file.

