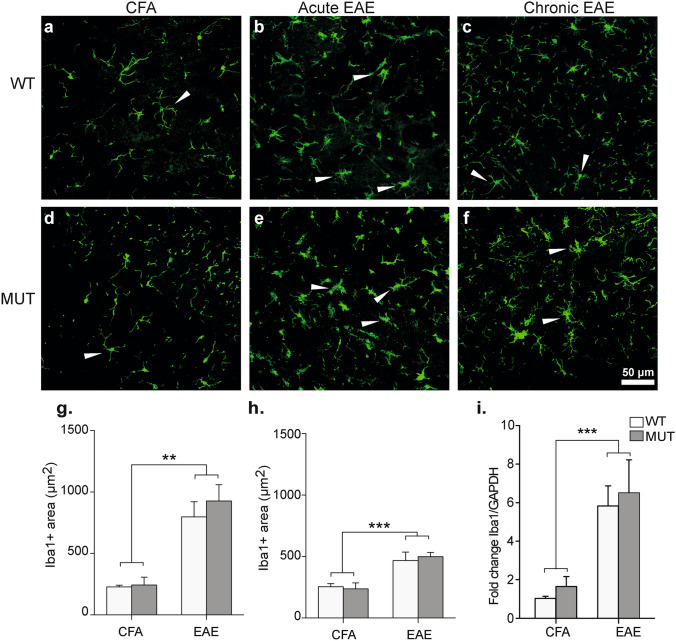
Figure 7.
Microgliosis and Iba-1 expression analysis. (a–f) Representative sections of lumbar spinal cord from WT and MUT mice obtained at acute or chronic EAE stages and stained for the microglial marker Iba-1. Microglial cells from control CFA mice (a,d) showed small somas and thin projections. During acute EAE (b,e), microglia cell soma increased in size and projections became shorter and wider, indicative of microgliosis and microglial activation (white arrowheads). At chronic EAE stage (c,f) less cells evidenced an activated morphology (white arrowheads). Scale Bar: 50 μm. (g,h) Total area occupied by Iba-1 (µm2) was measured by a particle size exclusion analysis. In (g) acute and (h) chronic stages, Iba-1 + area was significantly higher in both WT-EAE and MUT-EAE group compared to CFA groups. Data is presented as mean ± SEM. A two-factor ANOVA test and Tukey post hoc test was performed. **p < 0.002, ***p < 0.0002. CFA-WT n = 4; CFA-MUT n = 4; EAE-WT n = 5; EAE-MUT n = 5, for each stage. (i) At 30 dpi, lumbar spinal cords were obtained from CFA and EAE mice in order to isolate the mRNA and analyze the expression levels of Iba-1 by Real Time RT-PCR. GAPDH was used as the housekeeping gene. Graph shows the fold change of expression calculated as 2−ΔΔCT. Iba-1 relative expression levels were higher in all mice immunized with MOG compared to CFA and it was similar between WT and MUT mice. All values are presented as mean ± SEM. Two-way ANOVA and Tukey post hoc test were performed. ***p < 0.0021. WT-CFA n = 6; MUT-CFA n = 8; WT-EAE n = 6; MUT-EAE n = 9.

