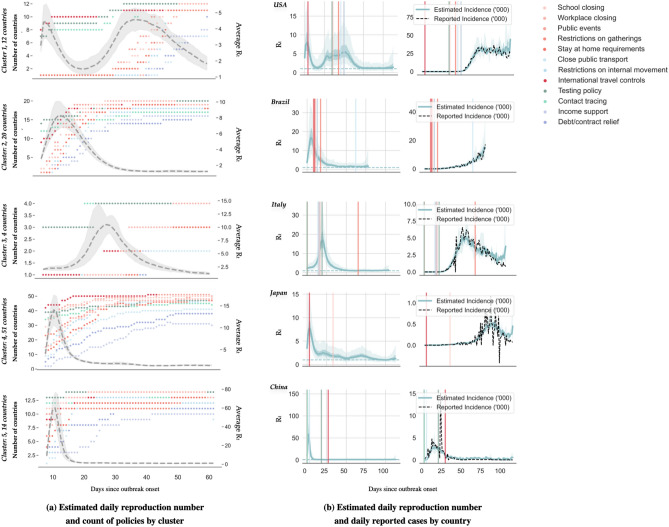
Figure 2.
Patterns of early public health interventions and the evolution of effective reproduction number by cluster. (a) The left panel shows the estimated daily reproduction number for each cluster during the first 60 days of the epidemics. The dashed gray line represents the median and the light gray shading represents the 5th to 95th quantiles. The number of countries that adopted the corresponding selected public health intervention are displayed using colored dots. (b) The left side of the right panel shows the mean estimated daily reproduction number in selected countries until 15 May 2020. The right side of the right panel displays the reported (in dashed black line) and estimated average incidence counts (in solid blue line). In both cases, the light and dark blue shading represent 75% and 95% confidence intervals of the model estimate respectively, and the colored lines mark the initiation of the corresponding selected public health intervention.

