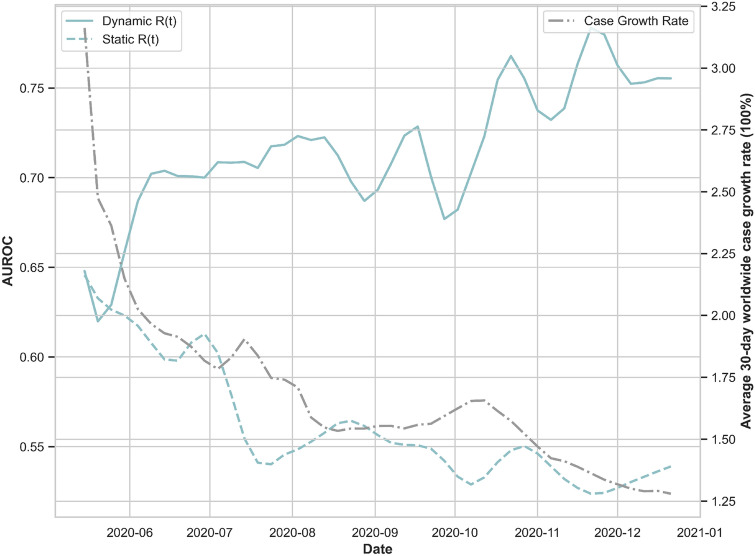
Figure 4.
Outbreak prediction accuracy of the stochastic SEIRD model with dynamic and static effective reproduction numbers. This figure depicts the AUROC corresponding to 30-day outbreak predictions over 230 daily rolling windows from 15 May 2020 to 31 Dec 2020, and averaged over the selected 101 countries. The solid blue line corresponds to forecasts using the daily updated reproduction number averaged over the last five days previous to the time of prediction. The dashed blue line corresponds to forecasts in which the daily reproduction number remains static as the average over 11–15 May 2020.

