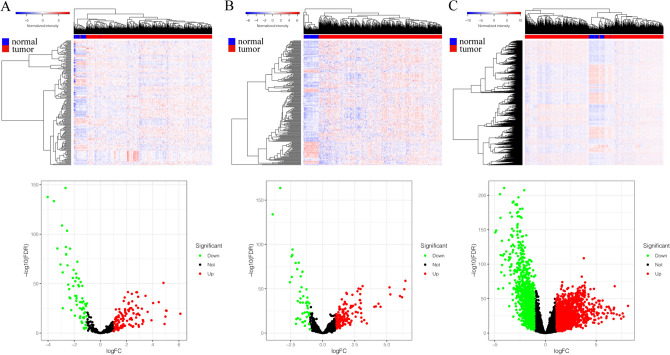
Figure 1.
Differently expressed RNAs in TCGA lung adenocarcinoma. (A) The heatmap of the miRNAs expression in LUAD, and the volcano graph shows the distribution of differently expressed miRNAs. (B) The heatmap of the lncRNAs expression in LUAD, and the volcano graph shows the distribution of differently expressed lncRNAs. (C) The heatmap of the mRNAs expression in LUAD, and the volcano graph shows the distribution of differently expressed mRNAs. In the volcano graph, the X axis represents the fold changes of DEGs, and the Y axis represents the adjusted p-value, red dots present up-regulated genes and blue dots present down-regulated genes (log fold change > 1.0, p-value < 0.05).

