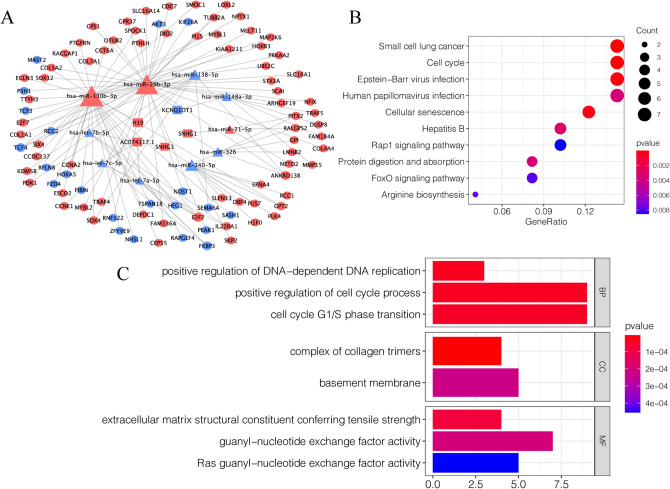
Figure 2.
Construction of the ceRNA network and functional enrichment analysis. (A)The ceRNA network of the differently expressed RNAs in lung carcinoma. The triangle nodes indicate miRNAs; the rectangle nodes indicate lncRNAs; the ellipse nodes indicate mRNAs. The blue nodes indicate down-regulated genes; the red nodes indicate up-regulated genes. Node size indicates the number of the interactions. (B) The KEGG enrichment analysis of the ceRNA network genes. (C) The GO enrichment analysis of the ceRNA network genes.

