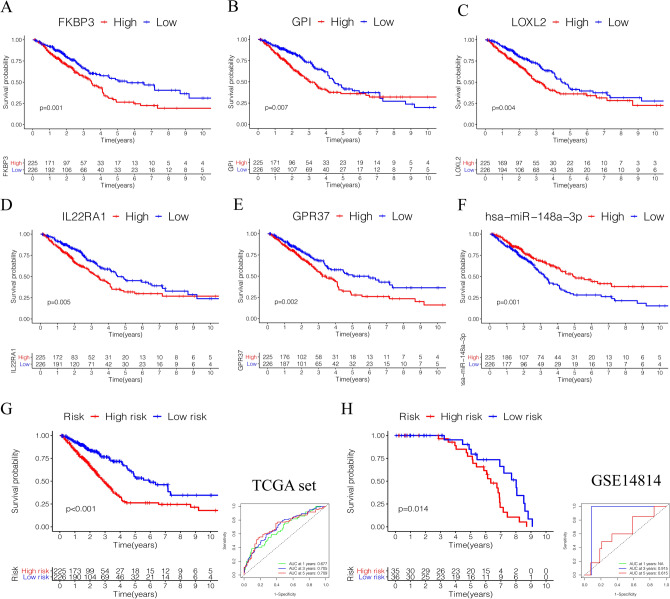
Figure 4.
Survival analysis of prognostic genes in ceRNA network. (A–F) The Kaplan–Meier curves validated the 6 key genes (FKBP3, GPI, LOXL2, IL22RA1, GPR37, has-miR-148a-3p) were significantly associated with overall survival, p-value < 0.05. (G) The Kaplan–Meier overall survival curves for risk score groups. Red curves represent high risk group and blue curves represent low risk group, p-value < 0.05. (H) The ROC curves showed that the area under curve (AUC) at 1 year was 0.677, at 3 year was 0.705, and at 5 years was 0.709.

