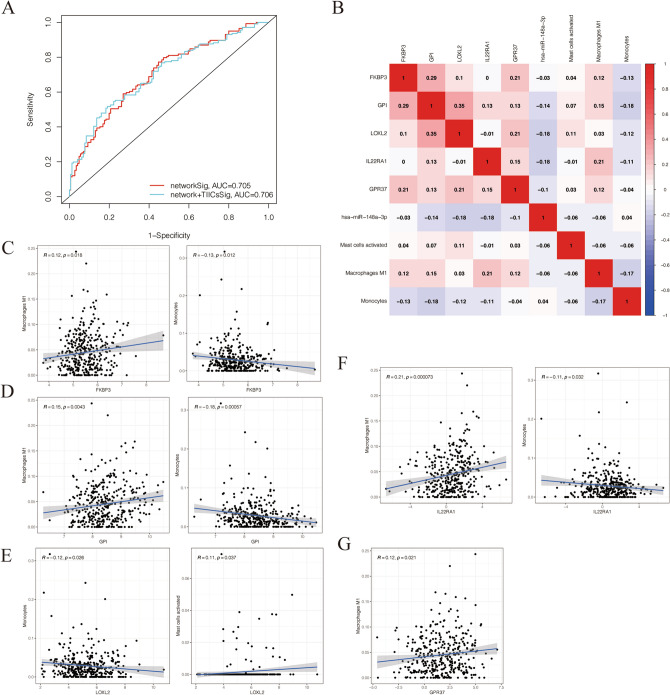
Figure 8.
Correlation analysis between the key genes of ceRNA network and the prognostic immune cells. (A) The ROC curves of the ceRNA network signatures and ceRNA network combined TIICs signatures. (B) The co-expression heatmap of all key genes and the prognostic immune cells. (C) The FKBP3 was associated with Monocytes and Macrophages M1. (D) The GPI was associated with Monocytes and Macrophages M1. (E) The LOXL2 was negatively associated with Monocytes and Activated mast cells. (F) The IL22RA1 was related with Monocytes and Macrophages M1. (G) The GPR37 was associated with Macrophages M1. R, correlation coefficients. p-value < 0.05.

