Figure 4.
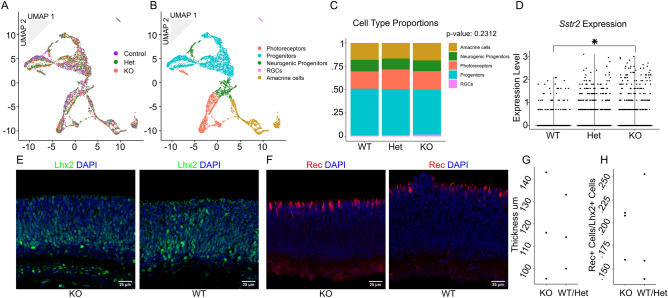
MULTI-seq and immunohistochemistry analysis of wildtype, Sstr2+/−, and Sstr2−/− littermates reveals no change in cell-type proportions at P0. n = 2 samples per genotype (except + / + where n = 1). n = 5,706 cells (Sstr2+/+: 1207, Sstr2+/−: 2341, Sstr2−/−: 2158). (A) 2D UMAP dimension reduction representation of the pooled retinal cells colored by genotype. (B) Cells colored by identified cell types. (C) Bar graph representation of the proportion of each cell type within each genotype. P-value for significance in difference of cell type proportions across genotypes were calculated using Pearson’s Chi-squared test. (D) Violin plot of expression of Sstr2 in cells for each condition. Was found to be significantly different by Seurat function ‘FindMarkers’. (E–H) P0 Retinas stained with (E) Lhx2 (green) or (F) Recoverin (red) antibodies and counterstained with DAPI (blue) with Sstr2−/− in the left panel and Sstr2+/+ in the right panel. Scale bars represent 25 μm. Dot plots representing (G) retinal thickness (n = 3) and (H) the density of Rec + cells corrected by the density of Lhx2 + cells for that biological replicate (n = 3). No significant difference found by Welch’s two-sample t-test.

